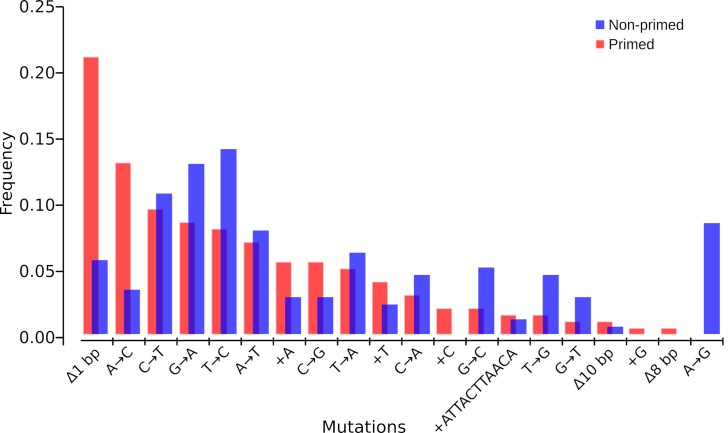
Fig 11. Frequencies of different types of mutations among evolved populations of both primed and non-primed conditions.
Mutational spectra. The number of mutations (nucleotide substitutions and indels) is plotted against respective nucleotide positions within the gene fragment. In this analysis, the mutations were taken by type regardless of the targets by generating two frequency datasets to compare frequency by type of mutation of evolved populations under priming and non-priming regimes. The mutational spectra are significantly different between the two conditions according to the spectrum analysis software iMARS [46].

