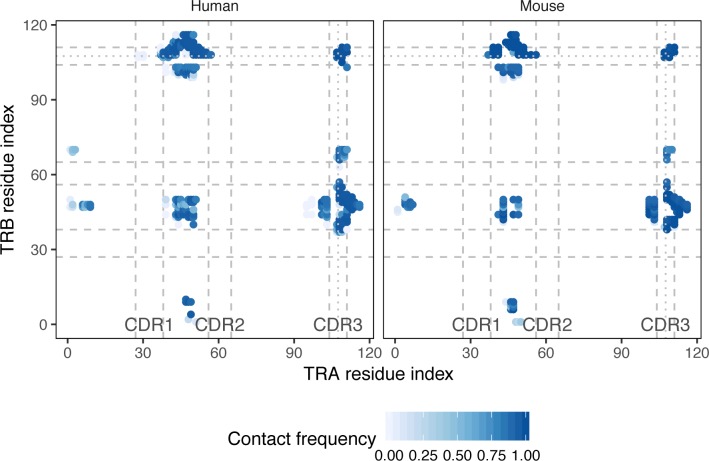
Fig 1. Contact map of TCRαβ complexes.
A heatmap of inter-chain residue contact frequencies observed in n = 131 human and n = 39 mouse TCR:peptide:MHC complexes. Residue pairs having a distance between closest atoms of less than 5Å in at least one complex were considered in the analysis. Contact frequency was estimated by counting the number of times a given residue pair has a Cα distance of less than 15Å in PDB structures. CDR regions are shown with dashed lines, excluded middle portion of CDR3 is shown with dotted line.

