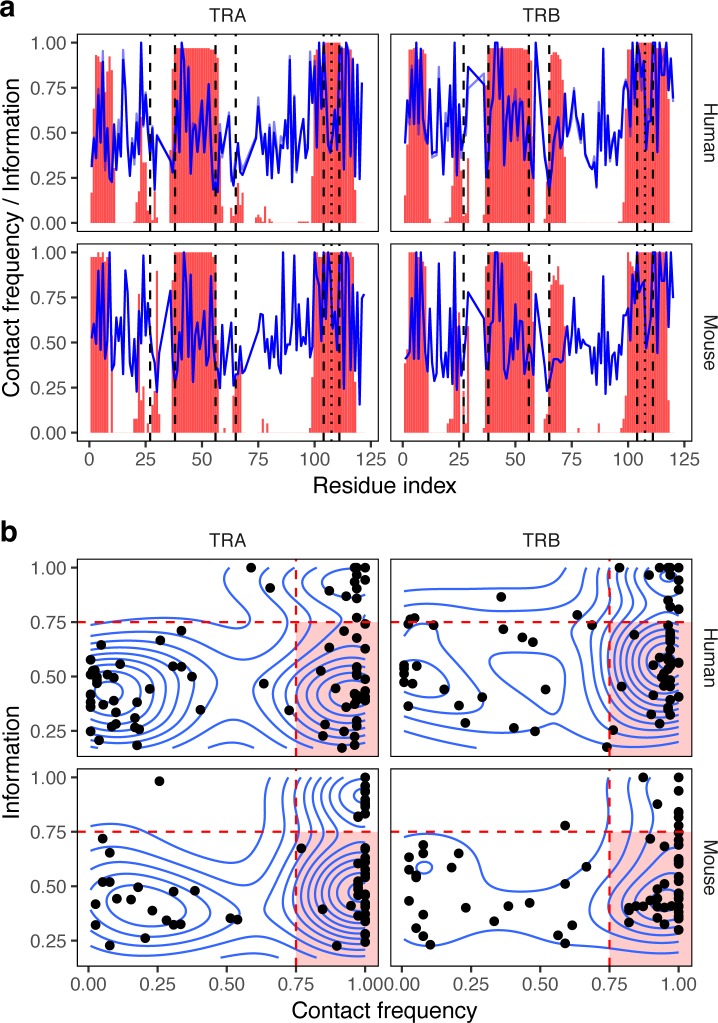
Fig 2. Variability and contact frequency of TCR chain residues.
a. Contact frequency (red bars) and information content (blue line) across α and β chains. For human, transparent blue line shows information content computed from residue frequencies weighted by corresponding V and J gene usage in donor repertoires. Dashed lines show FR-CDR boundaries. b. Scatter plot represents the probability of being involved in inter-chain contact (x axis) and information content of amino acid frequency distribution (y axis) for individual α and β chain residues. Region with a selection of frequently contacted residues (x > 0.75) that are have variable amino acid content (y < 0.75) is highlighted with a red background. Residues with more information content should be considered as less variable, residues having no inter-chain contacts are not shown.

