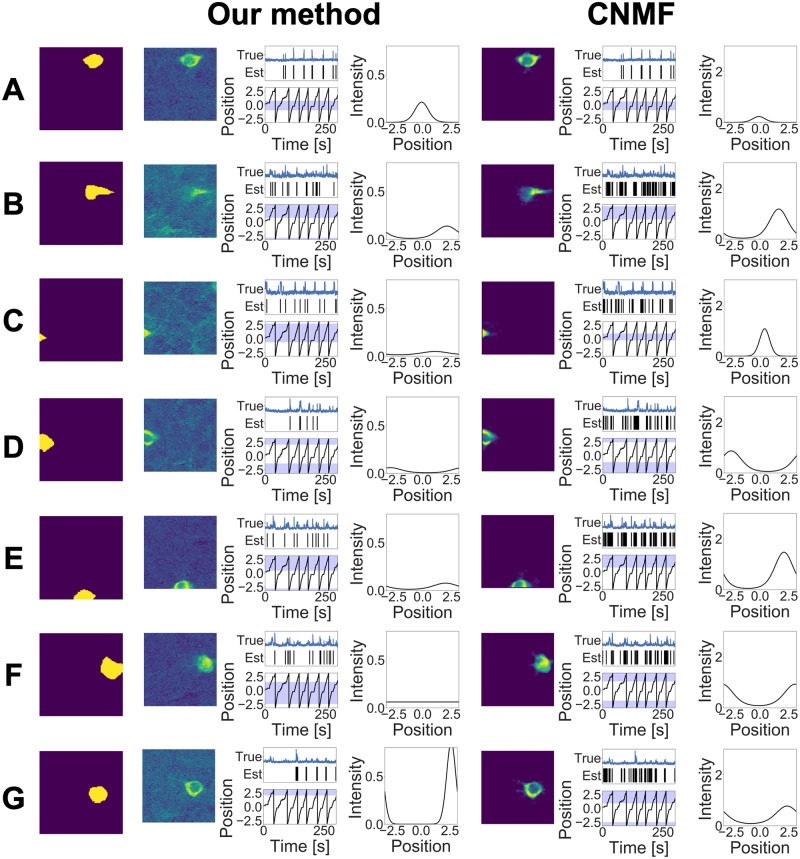
Fig 6. (A)–(G) Estimation results obtained by the two methods in the experimental study.
The first column indicates the ground truths, the second column shows the components obtained by our method, and third column shows those obtained by CNMF. Each component consists of three images. (Left) Estimated cell shape. (Middle) Calcium trace, estimated spiking time, and receptive field. The blue line indicates the normalized calcium trace within the ROI, and each vertical line indicates the estimated index when the spike occurred. The black line plot shows the position of the mouse, and the blue band shows the receptive field decided by μx and τx. (Right) Estimated tuning curve.

