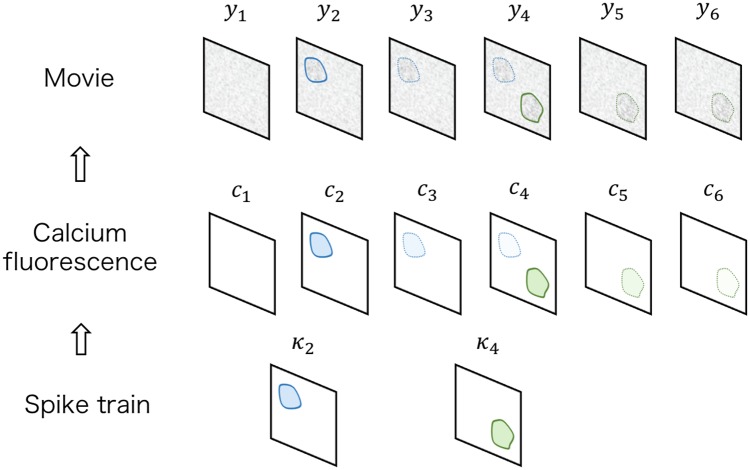
Fig 9. Calcium fluorescence model.
The marked spike sequences κ contain fluorescent footprints of the spikes. Given κ, the calcium fluorescence c and the observed movie y are generated from a linear state space model including jumps. Because cr and κr are not defined on the space of yr, these variables are represented as transformed versions Gcr, Gκr in this figure for intuition. When a spike occurs, the footprint of this spike is added to the calcium fluorescence, and then, it gradually decreases according to the calcium ion decay dynamics. The blue and green components indicate that the fluorescent footprints of the spikes originated from different neurons.

