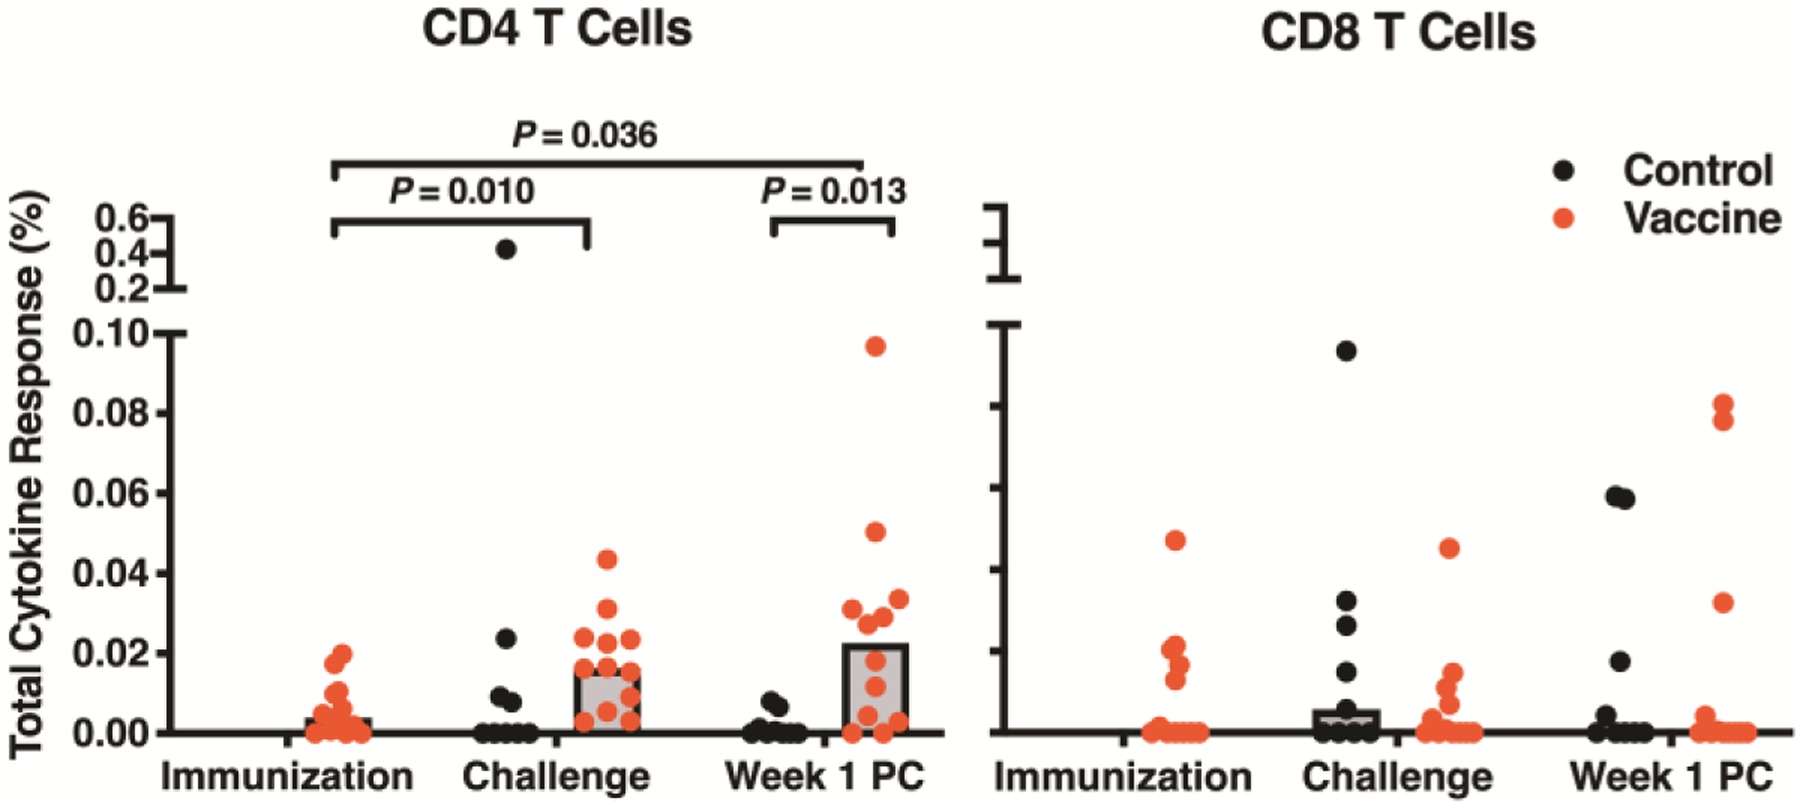
Fig. 5. T cell responses to Zika virus E protein in vaccine and control groups measured by intracellular cytokine staining.

The frequencies of total CD4 and CD8 T cells producing interleukin 2, interferon γ, and tumor necrosis factor α, or a combination of these cytokines, were measured at time of immunization (vaccinated animals only), day of first ZIKV challenge, and week one post-challenge (PC). Boolean gating was performed, responses were background subtracted, and all cytokine positive gates were summed using SPICE software to calculate the total frequency of cytokine-positive T cells responding to the E peptide pool. Samples with less than 35,000 events and 35% viability were excluded from analysis; therefore, twelve vaccinated animals and nine control animals are depicted. Statistical significance was calculated by Student’s t-test. Bars are drawn at the median.
