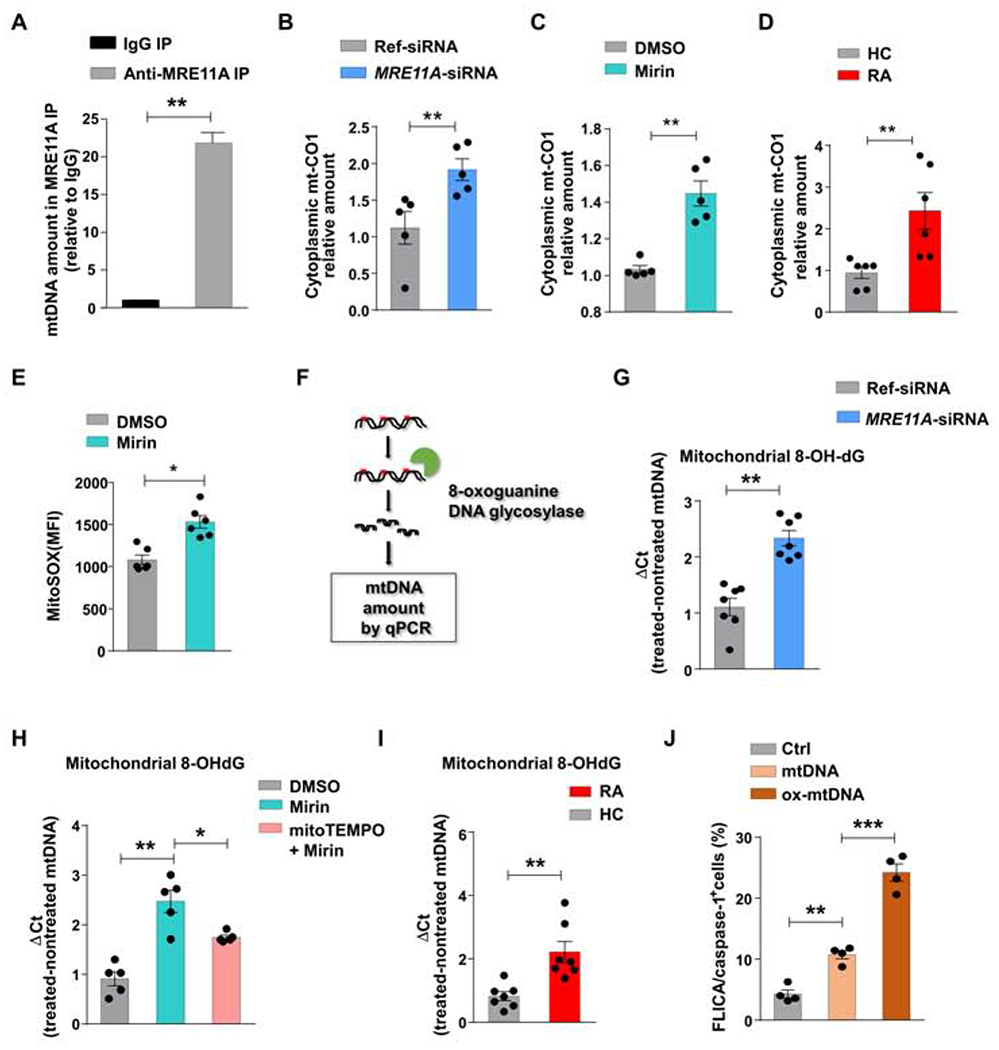
Figure 2: MRE11A protects mtDNA against oxidization and leakage.

(A) Mitochondria were isolated from Jurkat T cells. mtDNA bound to MRE11A was immunoprecipitated, purified, and quantified by RT-PCR. Data from 3 experiments. (B) Healthy CD4+ T cells (n=5) were transfected with MRE11A-siRNA or reference siRNA and stimulated for 72h. Cytosolic mtDNA quantified by RT-PCR. (C) Healthy CD4+ T cells (n=5) were treated with the MRE11A inhibitor Mirin (50 μM) or vehicle. Cytosolic mtDNA measured by RT-PCR. (D) RA and control CD4+ T cells (n=6 each) were stimulated for 72h. Cytosolic mtDNA was measured by RT-PCR. (E) Flow cytometrical detection of mtROS in healthy CD4+ T cells with or without Mirin treatment. (F) Experimental scheme of measuring 8-OH-dG in mtDNA. (G) MRE11A expression in control CD4+ T cells was inhibited by MRE11A-siRNA transfection (n=7). Mitochondrial 8-OH-dG quantified by RT-PCR. (H) CD4+ T cells were pretreated with mitoTEMPO (10 μM) for 2h and then MRE11A activity was inhibited by Mirin treatment (50 μM) (n=5). Mitochondrial 8-OH-dG quantified by RT-PCR. (I) CD4+ T cells from 7 RA patients and 7 controls were stimulated for 72h. mtDNA 8-OH-dG quantified by RT-PCR. (J) Jurkat T cells were transfected with non-oxidized and oxidized mtDNA and frequencies of FLICA+ cells were measured by FACS. All data are mean ± SEM. Paired t-test (A-C), Mann Whitney (D, I), Wilcoxon signed rank test (E, G), ANOVA and pairwise comparison using Tukey’s method (H, J). *p<0.05, **p<0.01, ***p<0.001. See also Fig.S2.
