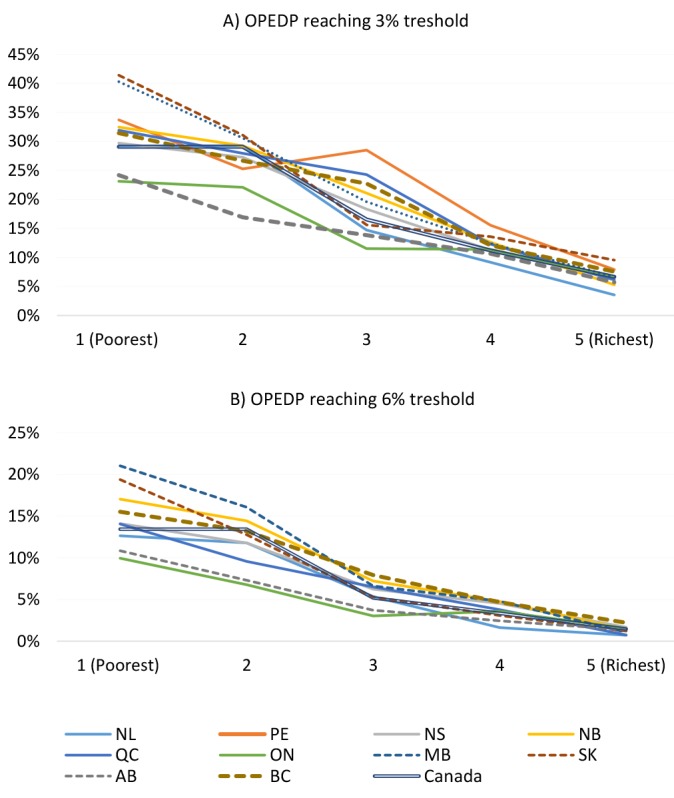
Figure 5.

Proportion of Households With COPEDP in 5 SES Quintiles Across Canadian Provinces Between 2010 and 2015: 3% and 6% of Total Household Consumption. Abbreviations: NL, Newfoundland and Labrador; PE,Prince Edward Island; NS, Nova Scotia; NB, New Brunswick; QC, Quebec; ON, Ontario; MB, Manitoba; SK, Saskatchewan; AB, Alberta; BC, British Columbia; COPEDP, catastrophic out-of-pocket expenses on drugs and pharmaceutical products; SES, socioeconomic status; OPEDP, out-of-pocket expenses on drugs and pharmaceutical products. Note: Proportions of households with COPEDP in five SES quintiles were not reported for PE in panel B of the figure as per the data disclosure policy of Statistics Canada’s Research Data Centres for small cell sizes (fewer than 5 unweighted households with the COPEDP in one of the SES quartiles).
Source: Authors’ calculation.
