
Figure 2 –
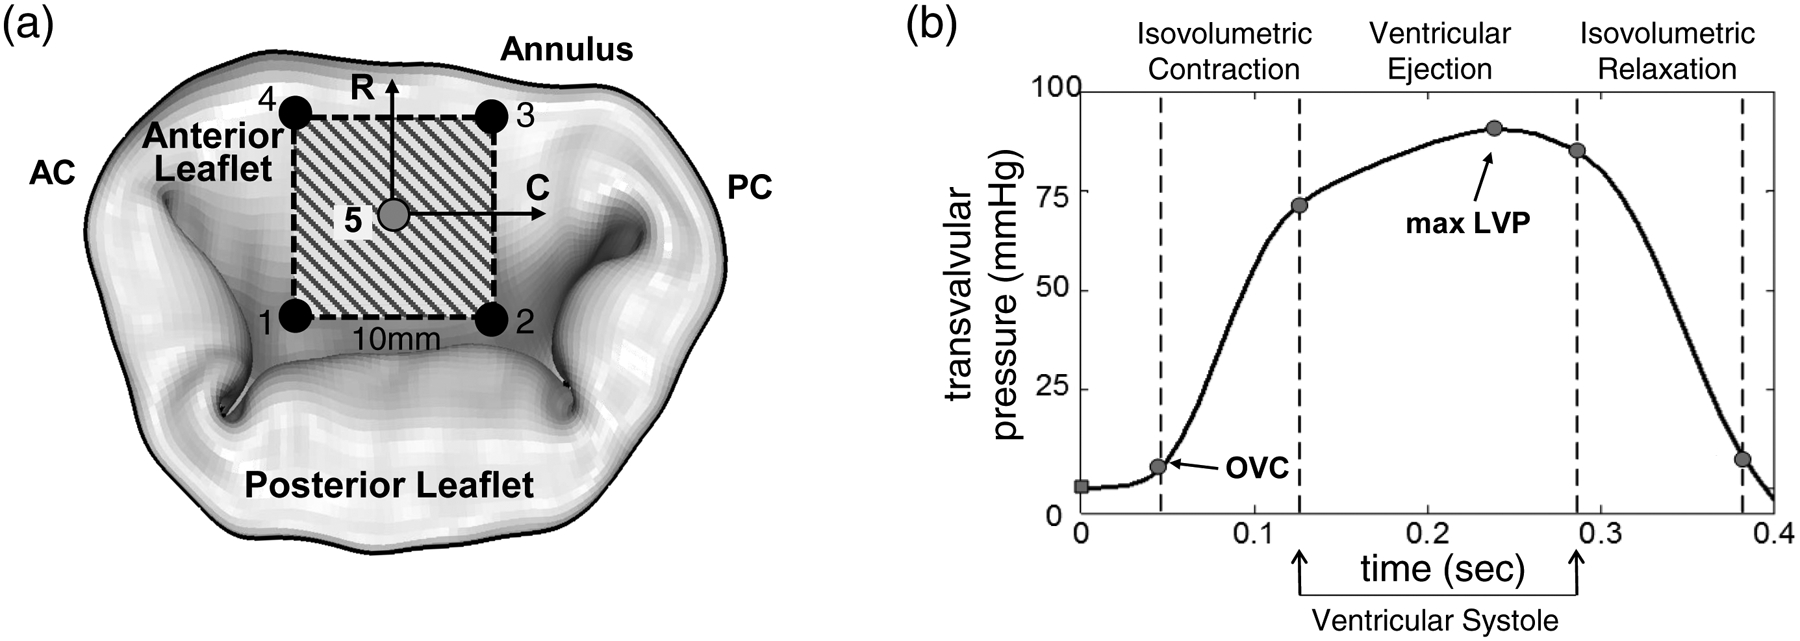
(a) Schematic of mitral valve leaflets and the arrangement of 5 sonocrystal transducers on the central region of the MVAL, (b) an illustration of the measured transvalvular pressure over one representative cardiac cycle, which was applied as pressure loading conditions for the FE simulations of the MVAL. The corresponding time points for in vivo reference configuration β2 and maximum pressure-loaded state βt,maxLVP were marked on the pressure-time curve. (LVP: left ventricular pressure).