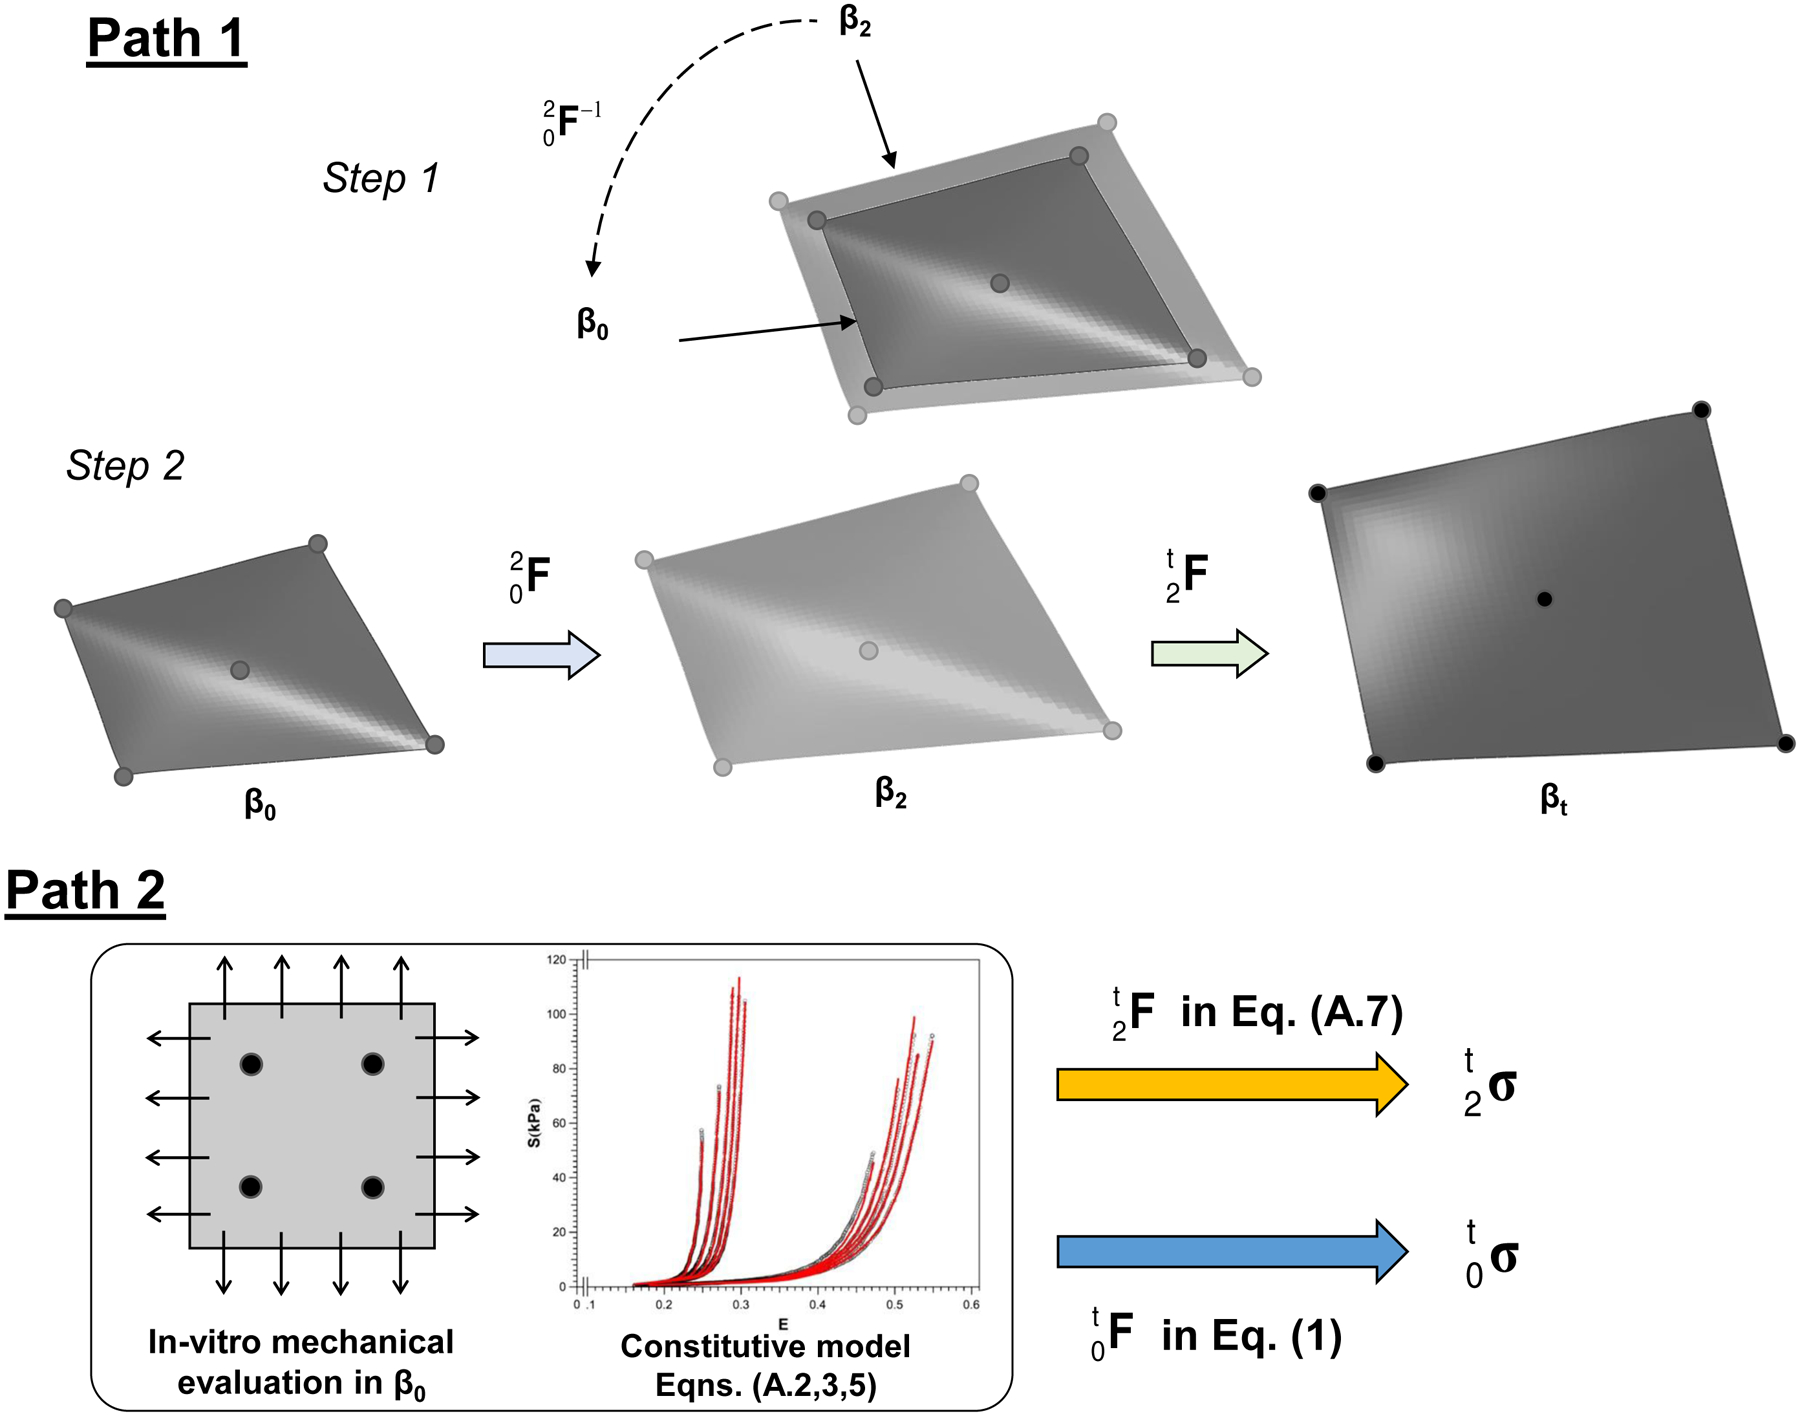
Figure 4 –

(Top) Illustrative diagrams of the two-step simulation procedure for the enhanced inverse FE modeling framework in Path 1: a simulation of the dimensional changes from β2 to β0, and a two-stage simulation for incorporating the quantified pre-strains with the inverse modeling framework from β0 to β2, and then to βt. Stresses were determined by averaging over 1,600 MVAL surface elements of the region of interest delimited by the ROI based on the FE simulation results. (Bottom) Schematic diagram of the forward (analytical) modeling approach in Path 2 and the corresponding equations used for the fitting of ovine biaxial testing data and for estimations of in vivo tissue stresses. Stresses were calculated at the center of the sonocrystal marker array.
