
Figure 9 –
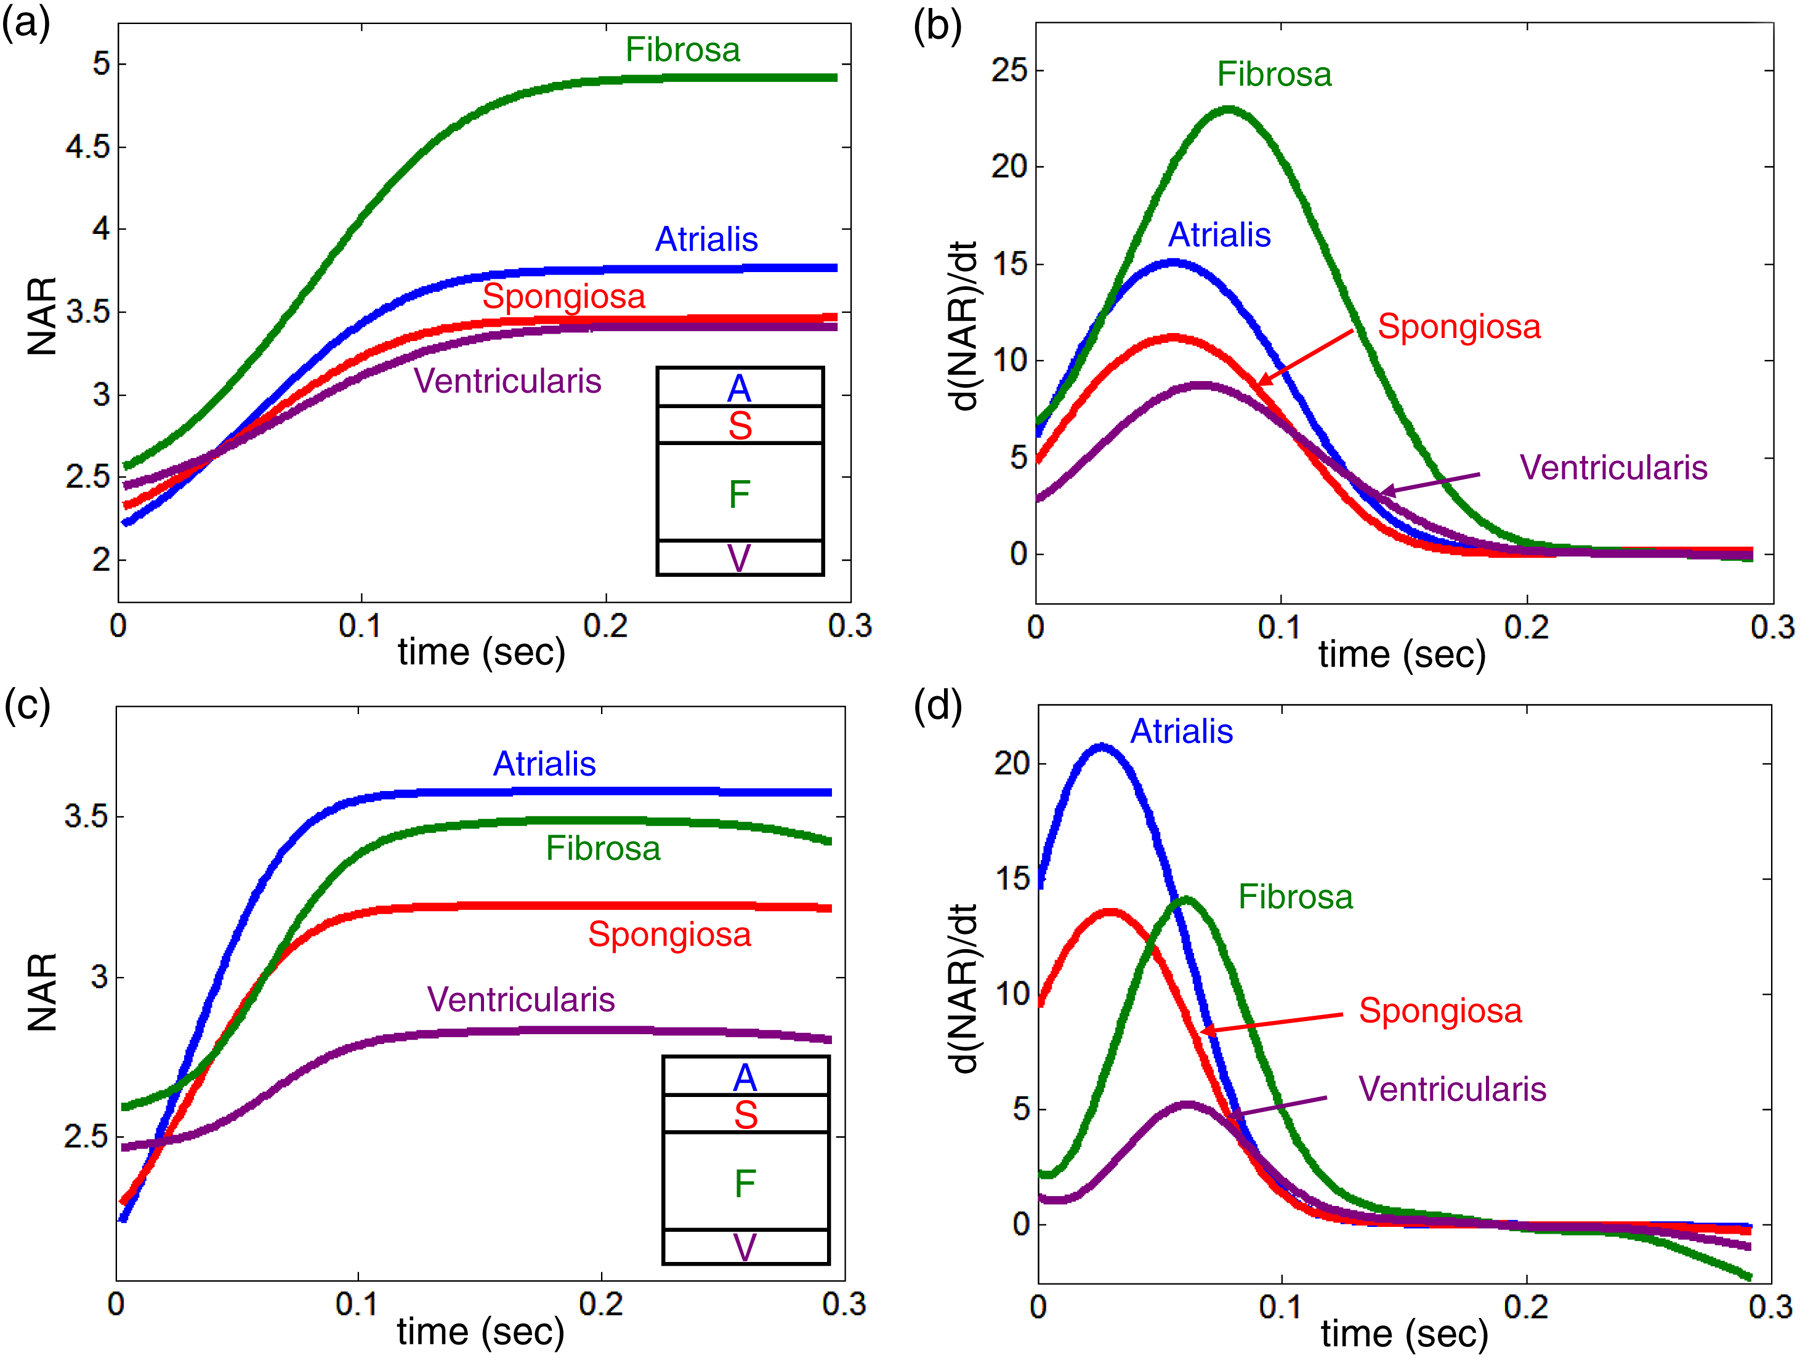
Predicted layer-specific NARs versus time for the MVs: (a) MVIC deformations (normal MV), (b) MVIC deformation rates (normal MV), (c) MVIC deformations (repaired MV), and (d) MVIC deformation rates (repaired MV). The inlet shows the hierarchy of the four MVAL tissue layers from the atrial surface to the ventricular surface)