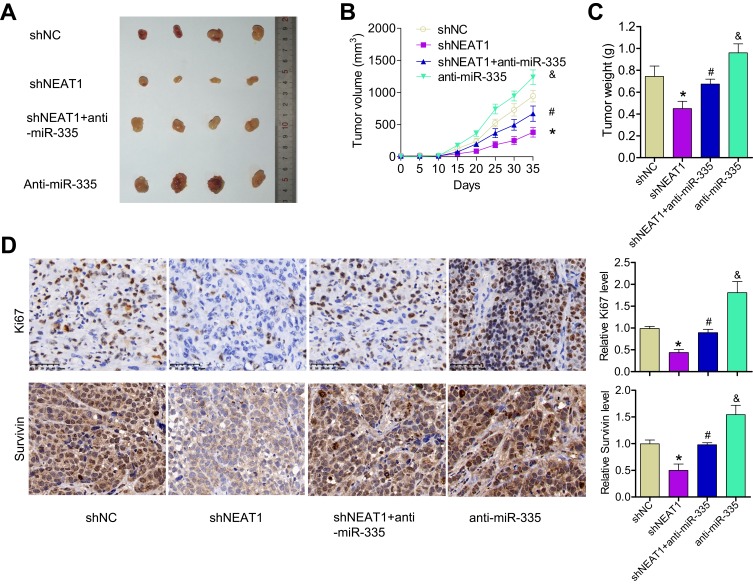
Figure 4.
Knockdown of NEAT1 inhibited tumor growth, in part through miR-335 downregulation in vivo. (A) Representative image of xenograft tumor formation in nude mice injected with shNC, shNEAT1, anti-miR-335, and shNEAT1 + anti-miR-335 transfected cells (n = 4 per group). (B) Tumor volume growth curves. (C) Tumor weight. (D) IHC showing Ki67 and survivin levels in tumor. *P < 0.05 vs the siNC group; #P < 0.05 vs the siNEAT1 group; &P < 0.05 vs the siNEAT1 + miR-335 inhibitor group.

