FIG 4.
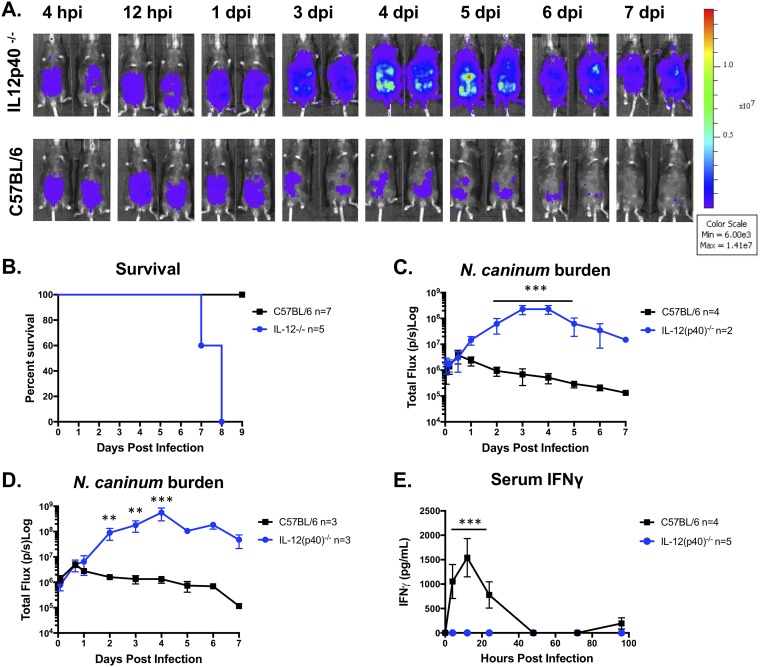
IL-12p40 knockout mice fail to control N. caninum infection but with different infection dynamics. Six-week-old C57BL/6 or IL-12p40 knockout (IL-12p40−/−) mice were injected i.p. with 106 Nc1:Luc tachyzoites. (A) Bioluminescence imaging data during days 0 to 7 postinfection. Hours postinfection (hpi) and days postinfection (dpi) are indicated (n = 2 per mouse strain). (B) Combined survival of IL-12p40−/− mice compared to control mice infected with N. caninum. Data shown are from two experiments (IL-12p40−/−, n = 5; WT, n = 7). (C) Quantification of bioluminescence data measuring parasite burden (total flux [photons per second]) over time (n = 2 per mouse strain). (D) Quantification of bioluminescence data from experimental repeats (IL-12p40−/−, n = 3; WT, n = 3). (E) Serum samples were collected at 0, 8, 12, 24, 48, 72, and 96 hpi and analyzed with a mouse IFN-γ ELISA. No IFN-γ was detected in IL-12p40−/− mice. The graph combines data from two experiments (IL-12p40−/− mice, n = 5; WT mice, n = 4). Control mice (n = 4) for the experiment in panel D were infected at the same time as multiple-knockout mice, and data from serum samples taken from these same mice are also shown in Fig. 6D. Cytokines were analyzed by two-way repeated-measures ANOVA (alpha value of 0.05) with Sidak’s multiple-comparison test. Imaging data were log transformed, and two-way repeated-measures ANOVA (alpha value of 0.05) and Sidak’s multiple-comparison test were then performed. **, P < 0.01; ***, P < 0.001.

