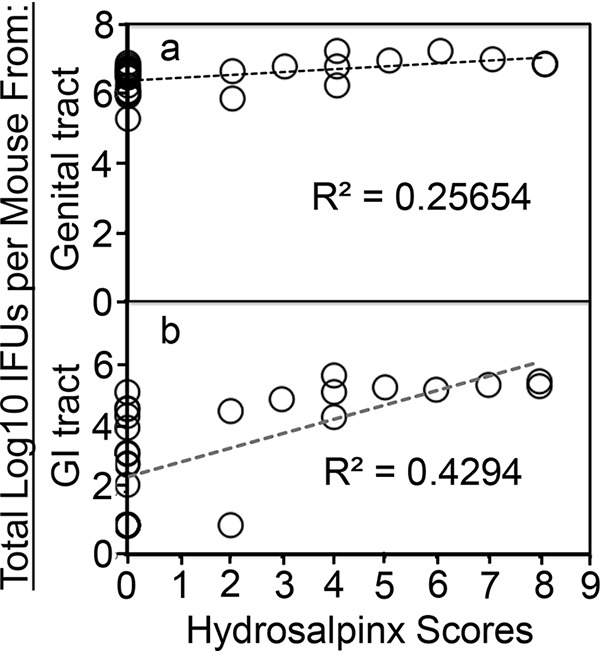
FIG 3.

Correlating mouse gross pathology hydrosalpinx with live organism recoveries from mouse genital or GI tracts. For Pearson correlation analyses, the hydrosalpinx score from each CBA1/J mouse (as displayed along the x axis) was plotted against live organism shedding in log10 total numbers of IFU from genital (a) or GI (b) tract swab specimens collected from a mouse over time (y axis). Each circle represents a mouse. The total number of IFU from each mouse was obtained by adding the numbers of IFU from all time points observed. The correlation coefficient r between the hydrosalpinx scores and the number of genital or vaginal IFU was 0.5065, while that between the hydrosalpinx scores and the number of GI tract or rectal IFU was 0.6553, given that r is the square root of coefficient of determination R2 in linear regression.
