FIG 6.

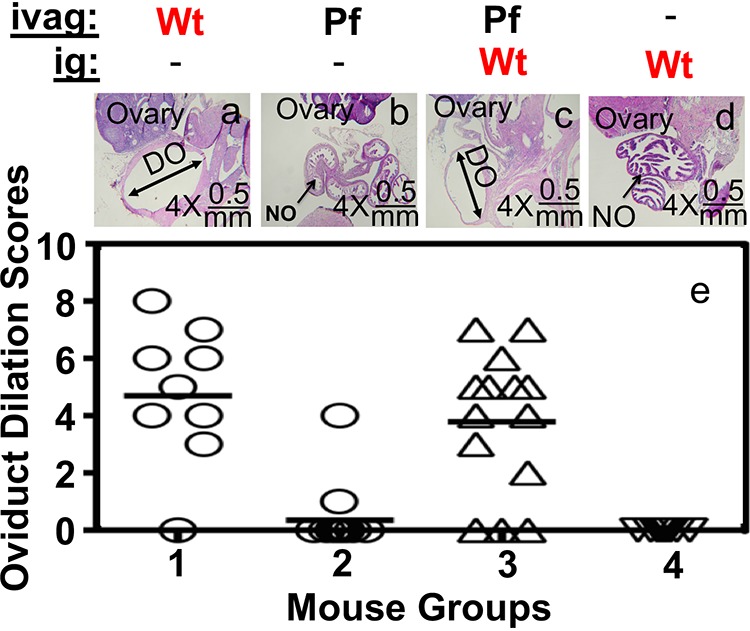
Detecting oviduct dilation under microscopy after coinfection. Groups of CBA/J mice (n = 10 to 14 per group) with or without coinfection as described in the Fig. 4 legend (panel a or group 1 for mice infected ivag with Wt CMpmCherry alone, panel b or group 2 for ivag Pf alone, panel c or group 3 for both ivag Pf and ig infection with Wt, and panel d or group 4 for ig Wt alone). On day 56, all mice were sacrificed for observing microscopically for oviduct dilation. Only one microscopic image (taken under a 4× lens objective) of the genital tract tissue is presented as a representative for a given group (panels a to d). Dilated oviducts (DO) are marked by double-headed arrows, while normal oviduct (NO) are marked by single-headed arrows. The ovary is also indicated. The oviduct dilation scores from all 4 groups are displayed in panel e. Open circles are used for mouse dilation scores in groups 1 and 2, while open upright triangles are used for group 3 and upside down triangles are used for group 4.
