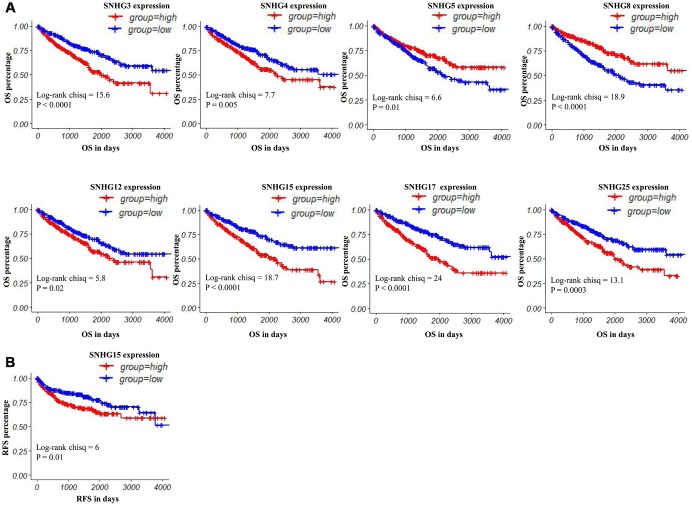
Figure 3.
Kaplan–Meier curves of OS and RFS in patients with ccRCC. (A) Patients were grouped according to the median cutoff of SNHG3, SNHG4, SNHG5, SNHG8, SNHG12, SNHG15, SNHG17 and SNHG25 expression for OS detection. (B) Patients were grouped according to the median cutoff of SNHG15 expression for RFS detection.

