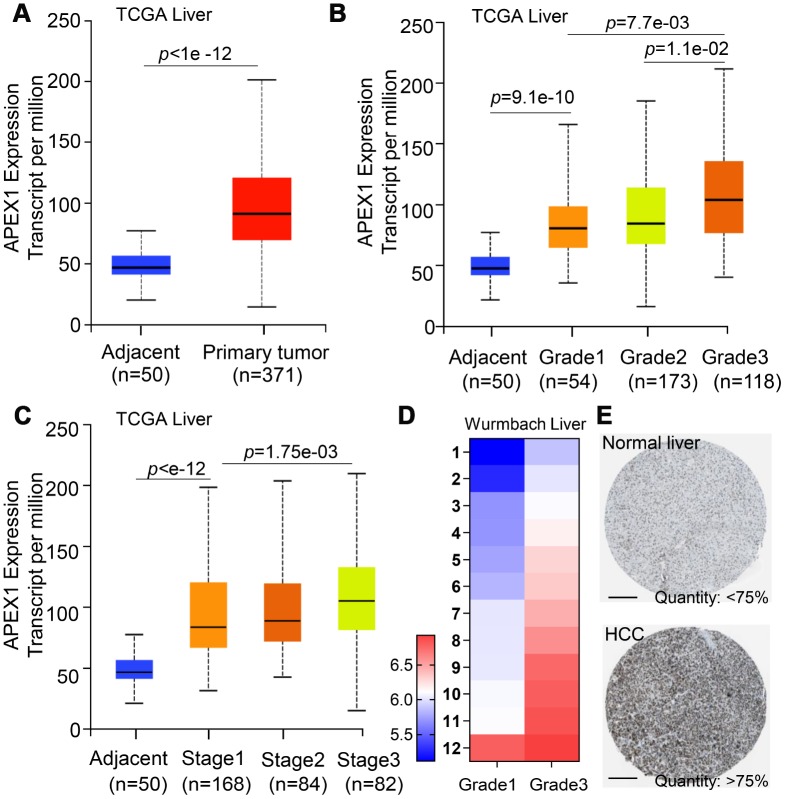
Figure 2.
APEX1 mRNA and protein expression correlates with HCC tumor grades. (A) APEX1 mRNA levels in 371 HCC and 50 normal liver tissues from the TCGA database are shown. (B) The histogram plot shows APEX1 mRNA expression in grades 1-4 HCC patients. As shown, APEX1 mRNA expression is incrementally upregulated with increasing tumor grades. (C) The histogram plot shows APEX1 mRNA expression levels in stages 1-4 HCC patients. As shown, APEX1 mRNA levels show incremental upregulation with increasing tumor stages. (D) The heat map shows APEX1 mRNA levels in grade 1 and 3 HCC patients in the Wurmbach Liver dataset from the Oncomine database. (E) Representative images show APEX1 protein expression in HCC and adjacent normal liver tissues that were obtained from The Human Protein Atlas database. The APEX protein expression was analyzed by immunohistochemistry. The scale bar is 200μm.

