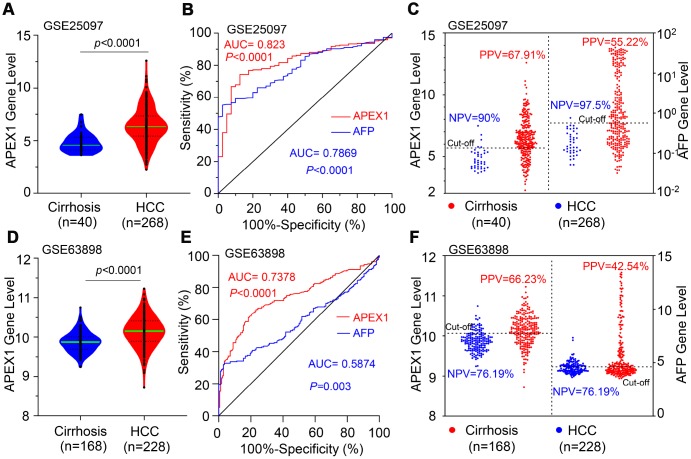
Figure 4.
APEX1 shows a higher positive predictive value than AFP in HCC patients. (A) The histogram plot shows APEX1 mRNA levels in patients with liver cirrhosis (n=40) and HCC (n=268) from the GSE25097 dataset. (B) ROC curve analysis shows the diagnostic value of APEX1 and AFP in liver cirrhosis and HCC patients from the GSE25097 dataset. (C) The optimal cut-off value for APEX1 and AFP in liver cirrhosis and HCC patients was determined according to the Youden and Product indices. Also shown are the positive predictive value (PPV) and negative predictive value (NPV) for APEX1 and AFP. (D) The histogram plot shows relative APEX1 mRNA levels in patients with liver cirrhosis (n=168) and HCC (n=228) from the GSE63898 dataset. (E) ROC curve analysis shows the diagnostic values of APEX1 and AFP in the liver cirrhosis and HCC patients from the GSE63898 dataset. (F) The optimal cut-off values for APEX1 and AFP in the liver cirrhosis and HCC patients was determined according to the Youden and Product indices. Also shown are the PPV and NPV for APEX1 and AFP.

