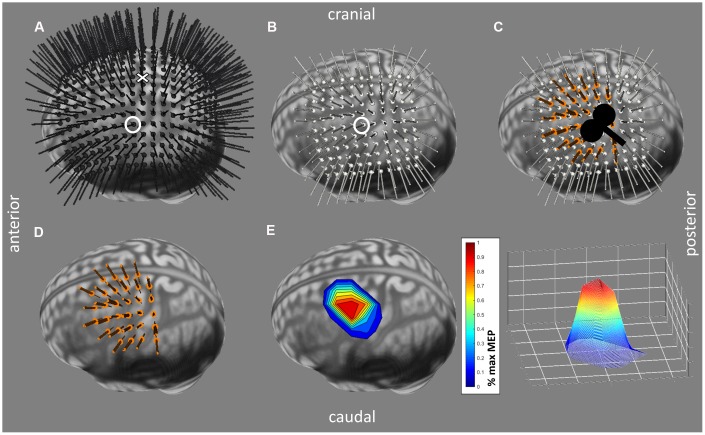
Figure 4.
Mapping Procedure performed with the Brainsight®2 software (Rogue Research Inc, Montreal, Quebec, Canada). (A) Grid used for searching the hotspot of 19x19, 1 cm-spaced predefined target locations and their trajectories around the vertex, visualized in black. The target representing the vertex is indicated by a cross, the hotspot by a circle. (B) Standardized mapping grid (11x11, 1 cm-spaced) around hotspot (circled target). Predefined target locations and trajectories are visualized in white. (C) Stimulated targets and their trajectories (in orange) are visualized on top of the mapping grid. Stimulation was performed in a 45° angle. (D) Similar to (C) without the mapping grid. (E) Cortical motor representation processed in Matlab with averaged motor evoked potential (MEP) values per point normalized to the individual maximal MEP.

