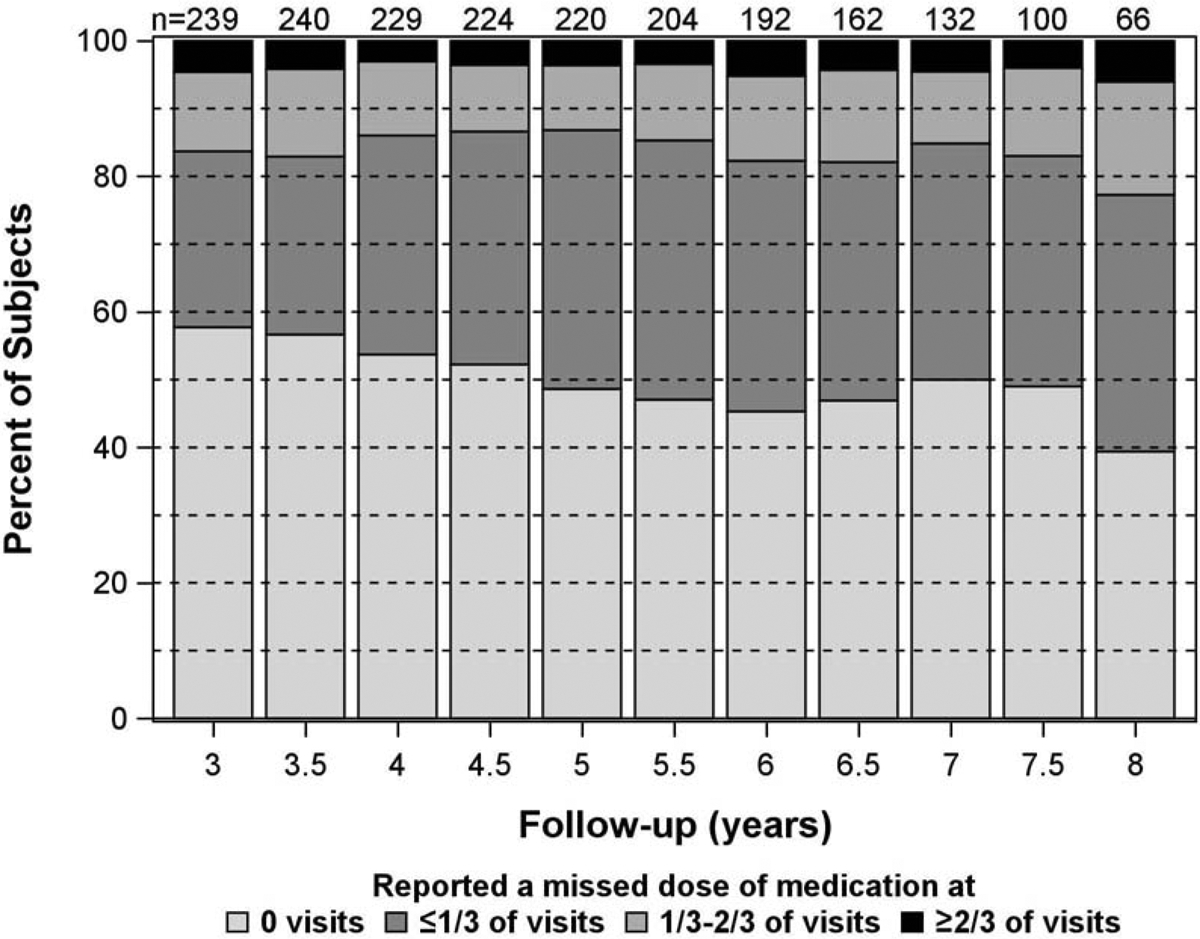
Figure 1.

Stacked bar charts showing the percentage of patients in each of the 4 categories of medication adherence over time from enrollment. For each patient at each visit, the category is assigned based on the cumulative number of visits with adherence divided by the total number of visits up to that point.
