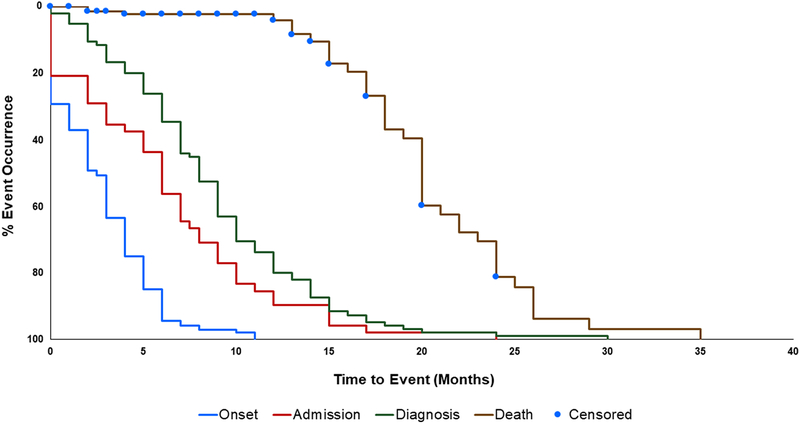
Figure 3: Cumulative time-to-event analysis of key points during disease progression.
First symptom onset (blue line, N = 140), first hospital admission (red line, N = 48), diagnosis of GM1 gangliosidosis (green line, N = 95), and death (brown line, N = 154) were mapped over time, demonstrating diagnostic times that are high relative to patient survival. Patients were censored at last date of follow-up.

