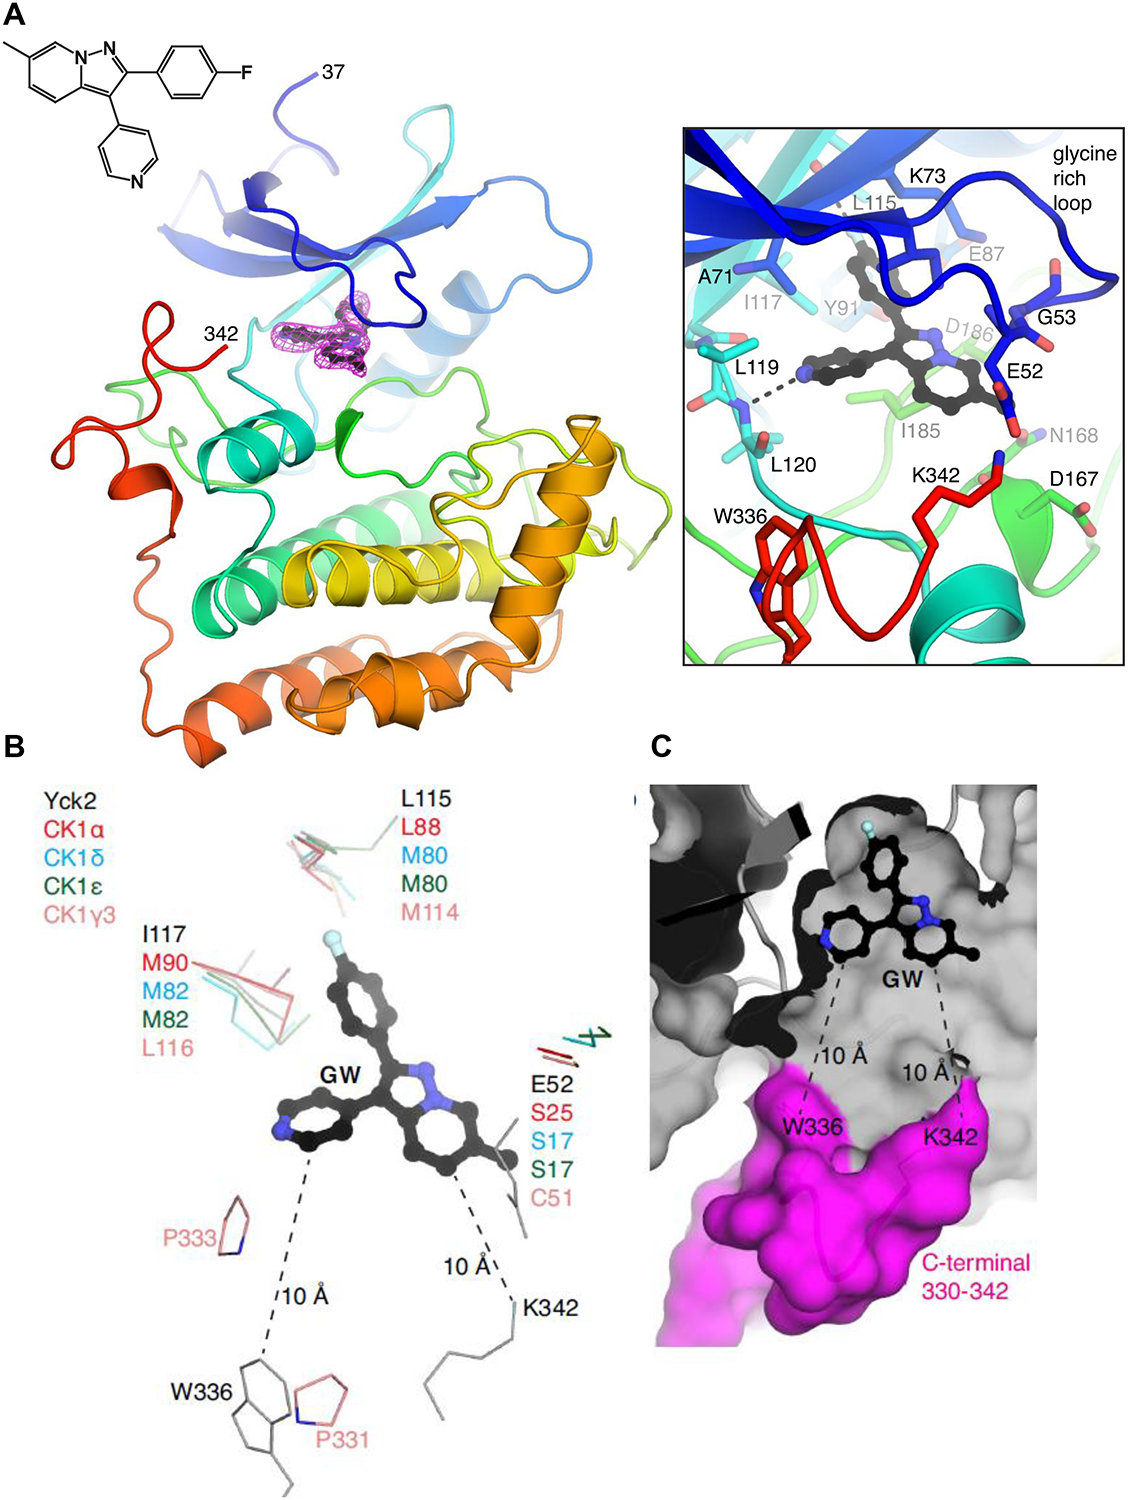
Figure 4: Structural insights into Yck2 as target of GW in C. albicans.

A, Structure of the Yck2-GW complex. (left) Protein is shown in cartoon representation, GW is shown in ball-and-stick. Electron density for GW is simulated annealing omit map at 3.0 σ. The amino acids at the N- and C-termini that are resolved in the structure are labeled. (right) Zoomed-in view of the ATP/GW-binding pocket. Hydrogen bonds are shown as dashed lines. B, Comparison of ATP-binding pockets of Yck2, human CK1α, CK1δ, CK1ε and CK1γ3. Only residues that show sequence/structural differences are shown. Yck2 E52 is part of the glycine-rich loop. The distances between GW and W336 and K342 are indicated. C, Surface representation of theYck2 kinase domain showing GW bound in the ATP-binding pocket and the C-terminal region colored in magenta. (See also Figures S4).
