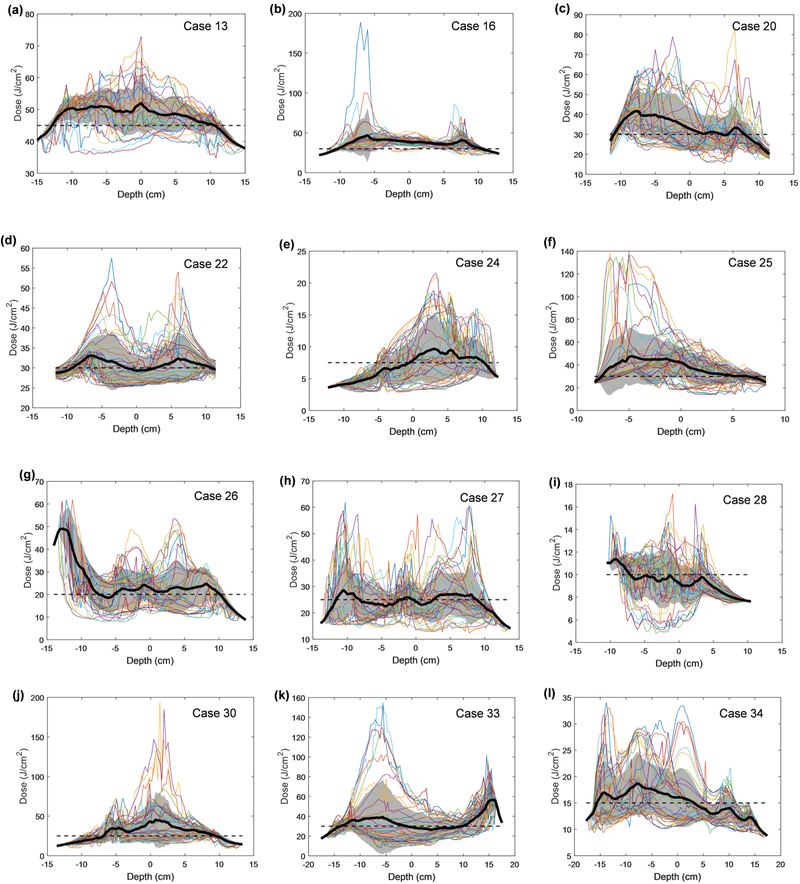
Figure 9.
Fluence distribution for all patients along the z-axis (depth) for each angular location. The mean is shown in a solid black line and the standard deviation is indicated by the grey shaded area. Uniformity is calculated as percent variation and summarized for each patient in Table 5.

