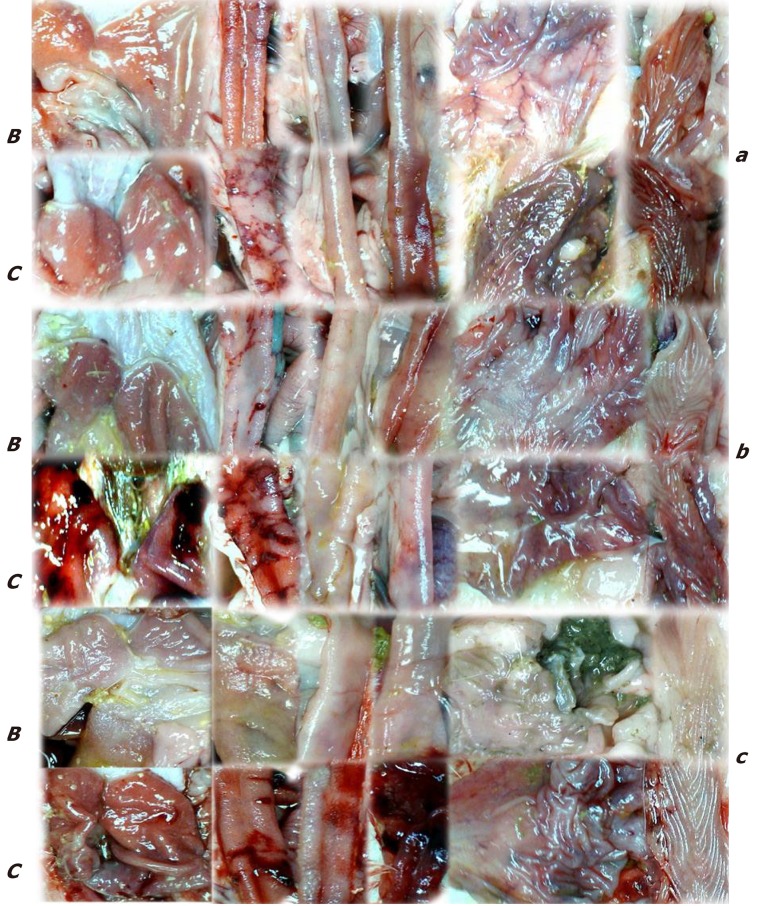
Figure 7.
Gross presentation of lesions (C) and lesions attenuation (B) in rats with suprahepatic occlusion of inferior vena cava. Lesions were assessed using a camera attached to a USB microscope (Veho Discovery Deluxe VMS-004), at 15 min (upper, a), 24 h (middle, b), and 48 h (low, c) post-ligation in the gastrointestinal tract. From left to right, the stomach, duodenum, jejunum, ileum, cecum and ascending colon on treatment with saline (C) or BPC 157 (B).

