Figure 1.
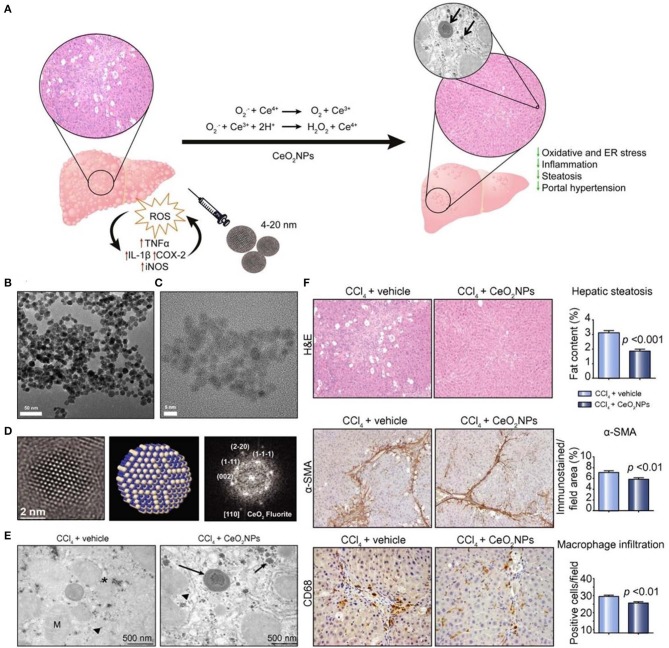
Schematic, characterization, and in vivo evaluation of CeO2 nanoparticles (NPs). (A) Schematic illustration of therapeutic mechanisms of CeO2NPs. (B) High-resolution transmission electron microscopy (HR-TEM) photomicrograph at low (43,000×) magnification revealing loose CeO2NPs agglomerates. (C) High magnification image (400,000×) of individual 4 nm CeO2NPs with spherical shape. (D) (Left) The HR-TEM image of single CeO2 NP showing the spherical morphology; (middle) atomistic simulation of CeO2NP with a characteristic fluorite-like electronic structure; (right) FFT of the selected nanoparticle with indicated atomic planes. (E) TEM image of liver tissue obtained from a CCl4-treated rat receiving vehicle and a CCl4-treated rat receiving CeO2NPs. Hepatocyte intracellular space containing mitochondria (M), organelles, fat droplets (asterisk), glycogen inclusions (arrow head), and aggregates of CeO2NPs (arrows). (F) Effect of CeO2NPs on hepatic steatosis, fibrogenic and infiltrating cells. Reproduced with permission from Oró et al. (2016).

