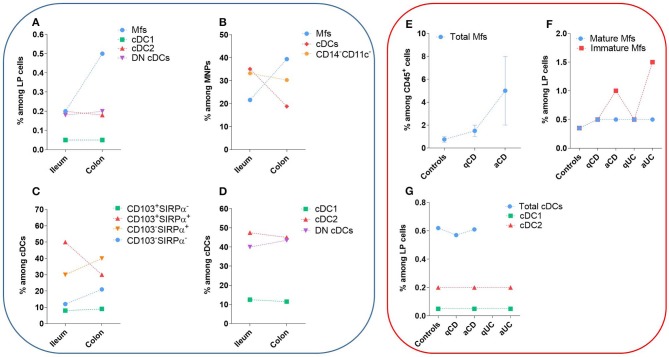
Figure 5.
Frequency of human intestinal MNP subsets in homeostasis and during IBD. These values do not take in account the number of patients or the standard error of the mean from each study. The dashed lines are only to clarify the difference between the type of tissue and do not represent paired values. (A–D) Frequency of human intestinal MNP subsets in homeostasis. (E–G) Comparison of human intestinal MNP subset frequencies in homeostasis and during IBD. a, active lesion areas; q, quiescent lesion areas. References: (A) (132, 225); (B) (226, 227); (C) (75, 134, 220); (D) (132); (E) (223, 228); (F) (132, 225, 228); (G) (132, 229).

