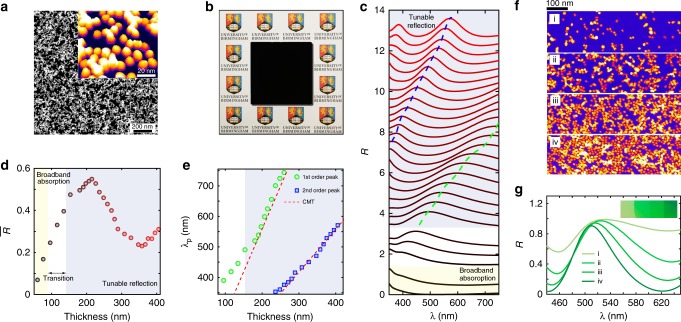
Fig. 3. Experimental realisation of the disordered plasmonic system.
a A typical STEM picture of Ag nanoclusters. The inset shows the 3D reconstruction plot. Disorder is introduced to the system by the deformed shapes and randomised positions of the clusters. b A sample with a fixed thickness around 60 nm, producing a completely black colour due to the disorder-induced broadband absorption. c The reflection spectra of the structure at different thicknesses, with reflection peaks marked as dashed lines. The transition is experimentally observed from broadband absorption to band-limited reflection with thickness-dependent reflection peaks. d The averaged reflection from 350 to 750 nm as the thickness varies. e The relationship between the peak shift and thickness from experiment, which shows a good match with our model based on coupled mode theory (red dashed lines). f STEM pictures for the hybrid platform with four different nanoparticle densities. g The corresponding reflection spectra for samples with different densities. The inset shows a photographic image, illustrating the vivid colour generation from the sample with stronger disorder.

