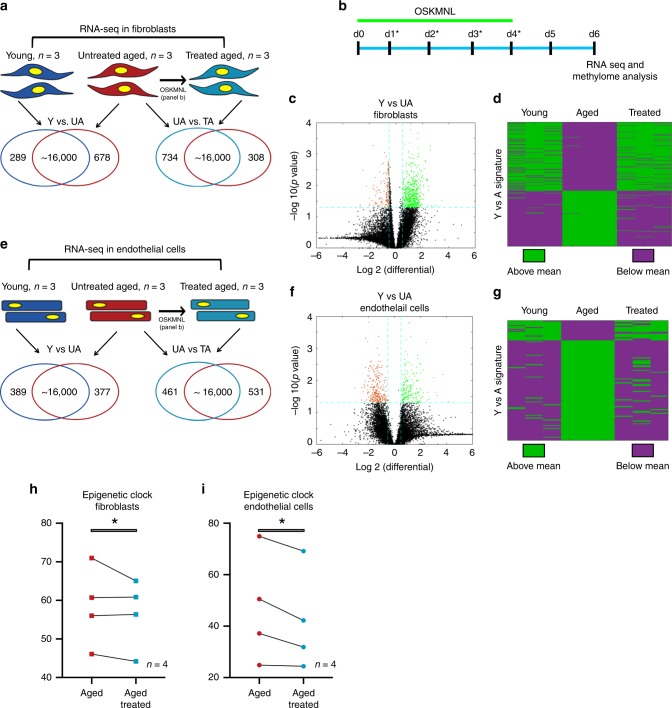
Fig. 1. Transcriptomic and epigenetic clock analysis shows more youthful signature upon transient expression of OSKMNL in human fibroblasts and endothelial cells.
a Venn diagrams show differentially expressed genes in fibroblasts (young, n = 3 individuals; aged and aged treated n = 3 individuals) defined with at significance p value >0.05 and log fold change >0.5. Comparison among the three groups was conducted by ANOVA test. b Schematic of reprogramming protocol. c Volcano plot showing young versus aged fibroblast differential gene expression. d Heat map of polarity of expression (green = above, purple = below) the mean for each differential gene. The distribution shows the treated samples transition in expression in this space towards the direction of the young fibroblasts. Cells in each cohort were subjected to 80 bp paired-end reads of RNA sequencing and quantile normalized. e Venn diagrams show differentially expressed genes in endothelial cells (young, n = 3 individuals; aged and age-treated n = 3 individuals) defined at significance p value >0.05 and log fold change >0.5. Comparison among the three groups was conducted by ANOVA test. f Volcano plot showing young versus aged endothelial cells differential gene expression. g Heat map of polarity of expression (green = above, purple = below) the mean for each differential gene. The distribution shows the treated samples transition in expression in this space towards the direction of the young endothelial cells. h Methylation clock estimation of patient sample age with and without treatment for fibroblasts; n = 4 individuals. i Methylation clock estimation of patient sample age with and without treatment for endothelial cells; n = 4 individuals. Statistical analysis of methylation clock was performed by two-sided t-test analysis.

