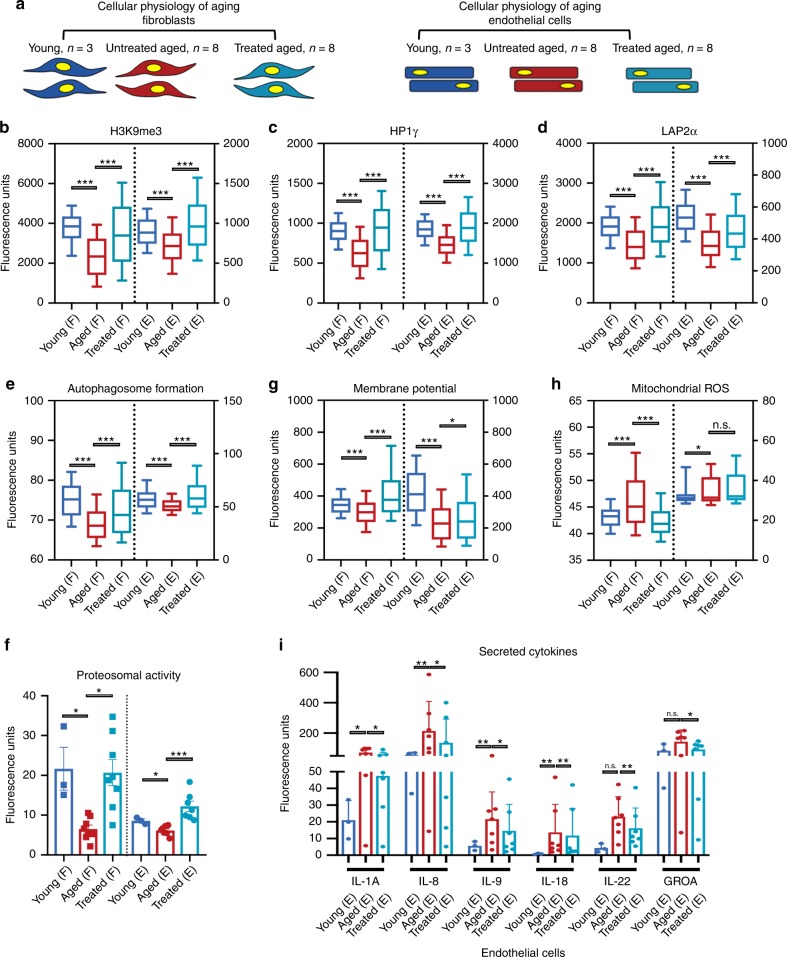
Fig. 2. Transient OSKMNL expression reverts aged physiology toward a more youthful state in human fibroblasts and endothelial cells.
a Fibroblasts (F) and endothelial cells were obtained from otherwise healthy young and aged individuals. Young untreated cells (n = 3 distinct individuals for both fibroblasts and endothelial cells, dark blue), aged untreated cells (n = 8 individuals for fibroblast, n = 7 individuals for endothelial cells, red), and aged treated cells (n = 8 for fibroblast, n = 7 for endothelial cells, light blue) were analyzed for a panel of 11 different hallmarks of aging. Most of the assays were performed by high-throughput imaging on 500–1000 cells per sample to allow population-wide studies with single-cell resolution (Supplementary Figs. 2–5). 100 cells per sample (i.e., individuals) were randomly selected and pooled per treatment group to do a statistical comparison across the three groups (young fibroblasts n = 300; aged fibroblasts n = 800; aged treated fibroblasts n = 800; young endothelial cells n = 300; aged endothelial cells n = 700; aged treated endothelial cells n = 700). Pairwise statistical analysis was done by one-way ANOVA. *P < 0.05, **P < 0.01, ***P < 0.001. b Quantification of single-nucleus levels of trimethylated H3K9, a repressive mark of gene expression. Both cell types show significant elevation of the mark towards the youthful distribution. c Quantification of single-nucleus levels of heterochromatin marker HP1γ by immunocytochemistry showing a trend toward youth upon treatment. d Quantification of the inner nuclear membrane polypeptide LAP2α, a regulator of nuclear lamina by regulating the binding of lamin B1 and chromatin. This again shows a trend toward youth after cells are treated. e Results of live cells imaging with florescent marker of autophagosome formation in single cells. f Cleavage of fluorescent-tagged chymotrypsin-like substrate elevated in treated and young fibroblasts and endothelial cells corresponding to increased proteasome 20S core particle activity. g Individual cell mitochondria membrane potential measurements also showing more active mitochondria as a result of transient reprogramming. Quantification of pro-inflammatory factors secreted by the cells in each cohort. h Individual cell mitochondria ROS measurements also showing less accumulated ROS as a result of transient reprogramming. i Inflammatory cytokine profiling in endothelial cells, with a significant elevation and depression specifically in aged and treated endothelial cells, respectively. In b–h data are represented as box–whisker plots with median, and bars represent whiskers with distribution variability 10th–90th percentile. In f–j data are represented as mean values and bars represent SD.

