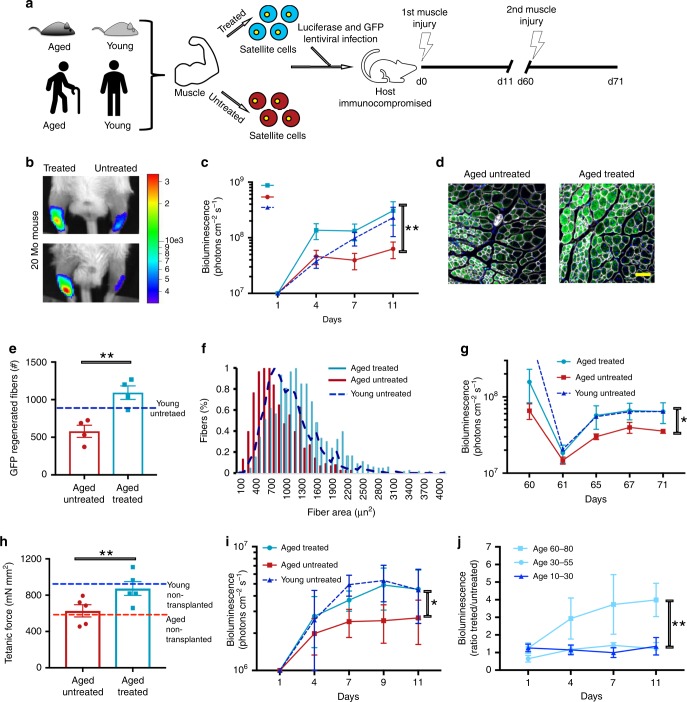
Fig. 4. Transient OSKMNL expression restores aged muscle stem cell potency.
a Schematic showing the experimental design of partially reprogrammed aged mouse and human MuSCs. b Representative images of bioluminescence measured from mice 11 days after transplantation and injury in TiA muscles of treated/untreated Luciferase+ mouse MuSCs. c Quantified results of bioluminescence in b at different time points following transplantation and injury (n = 10). d Representative immunofluorescence of GFP expression in TiA muscle cross-sections of mice imaged and quantified in c and d, isolated 11 days after transplantation (Scale bar = 500 μm). e Quantification of immunofluorescence staining in d (n = 5). f Quantification of the cross-sectional area of donor-derived GFP + fibers in TiA muscles that were recipients of transplanted MuSCs (n = 5). g Results of bioluminescence imaging of TiA muscles reinjured after 60 days (second injury) after MuSC transplantations (n = 6). The second injury was performed to test whether the bioluminescence signal increased as a consequence of activating and expanding luciferase+/GFP+ MuSCs that were initially transplanted and that had engrafted under the basal lamina. h Tetanic force measurements of aged muscles injured and transplanted with aged MuSCs. TiA muscles were dissected and electrophysiology ex vivo for tetanic measurement performed. Baseline of force production of untransplanted muscles was measured in young (4 months, blue broken line) and aged (27 months, red broken line) mice. Treated aged MuSCs were transplanted into TiA muscles of aged mice and force production measured 30 days later (n = 5). i Quantified results of bioluminescence measured from mice 11 days after transplantation in TiA muscles of treated Luciferase+ human MuSCs. j Variation in ratio of bioluminescence between treated and untreated MuSCs obtained from healthy donors of different age groups. Significance is calculated with one-sided student’s t test, pairwise between treated and aged, and group wise when comparing with young patients (age groups. 10–30: n = 5 individuals; 30–55: n = 7 individuals; 60–80: n = 5 individuals). *P < 0.05, **P < 0.01, ***P < 0.001, color of the asterisks matches the population being compared with.

