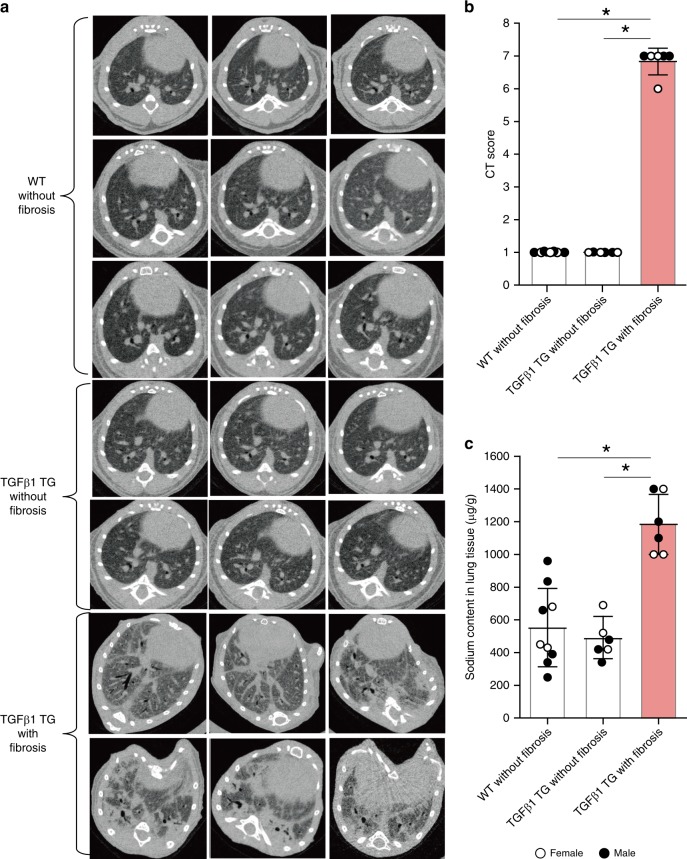
Fig. 1. The fibrotic lung tissue is a salty microenvironment.
a, b Chest computed tomography (CT) findings and CT scores of wild-type and TGFβ1 transgenic (TG) mice. n = 9 in WT without fibrosis, n = 6 in TGFβ1 TG without fibrosis and TGFβ1 TG with fibrosis. Bars indicate the means ± S.D. Statistical analysis by ANOVA with Tukey’s test. *p < 0.001. c The lung tissue Na+ was measured by microwave analysis/inductively coupled plasma mass spectrometry. Fibrotic lung tissues excised from wild-type and transforming growth factor (TGF)β1 TG mice with and without (n = 6) lung fibrosis. n = 9 in WT without fibrosis, n = 6 in TGFβ1 TG without fibrosis and TGFβ1 TG with fibrosis. Bars indicate the means ± S.D. Statistical analysis by Mann–Whitney U test. Statistical analysis by ANOVA with Tukey’s test. *p < 0.001. The source data underlying Fig. 1b, c are provided in the Source Data file.

