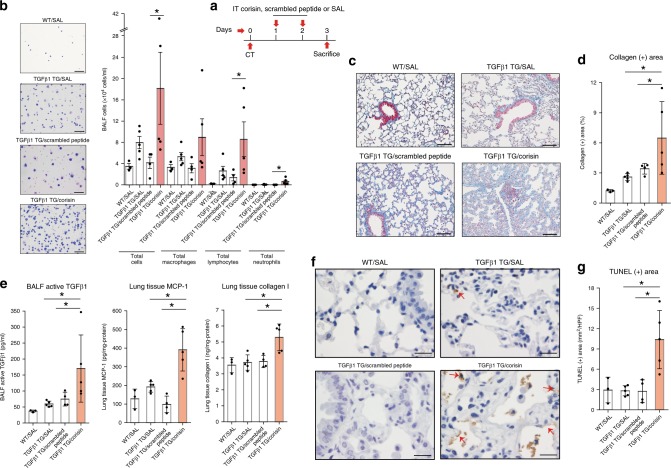
Fig. 6. Corisin exacerbates lung fibrosis in transforming growth factor β1 transgenic mice.
a Transforming growth factorβ1 transgenic mice (TGFβ1 TG) mice with matched lung fibrosis based on computed tomography (CT) score received intra-tracheal corisin (n = 5) or scrambled peptide (n = 4) or 0.9% NaCl solution (SAL; n = 5) on days 1 and 2 and sacrificed on day 3 to evaluate changes in lung inflammation and fibrosis. Wild-type (WT) mice without lung fibrosis (n = 3) treated with 0.9% NaCl solution were used as controls. n = 3 in WT/SAL, n = 4 in TGFβ1 TG/scrambled peptide, n = 5 in TGFβ1 TG/SAL and TGFβ1 TG/corisin groups. b Counting of bronchoalveolar lavage fluid cells. Scale bars indicate 100 µm. n = 3 in WT/SAL, n = 4 in TGFβ1 TG/scrambled peptide, n = 5 in TGFβ1 TG/SAL and TGFβ1 TG/corisin groups. Statistical analysis by two-tailed Mann–Whitney U test. *p < 0.05. c, d Quantification of collagen area by WinROOF software. Scale bars indicate 100 µm. n = 3 in WT/SAL, n = 4 in TGFβ1 TG/scrambled peptide, n = 5 in TGFβ1 TG/SAL and TGFβ1 TG/corisin groups. Bars indicate the means ± S.D. Statistical analysis by ANOVA with Newman-Keuls test. *p < 0.05. e The concentrations of TGFβ1, monocyte chemoattractant protein (MCP)-1 and collagen I were measured by enzyme immunoassays. n = 3 in WT/SAL, n = 5 in TGFβ1 TG/SAL and TGFβ1 TG/corisin, and n = 4 in TGFβ1 TG/scrambled peptide groups. Bars indicate the means ± S.D. Statistical analysis by ANOVA with Newman-Keuls test. *p < 0.05. f, g DNA fragmentation was evaluated by staining through terminal deoxynucleotidyl transferase dUTP Nick-End Labeling (TUNEL). Scale bars indicate 50 µm. n = 3 in WT/SAL, n = 5 in TGFβ1 TG/SAL and TGFβ1 TG/corisin, and n = 4 in TGFβ1 TG/scrambled peptide groups. Bars indicate the means ± S.D. Statistical analysis by ANOVA with Newman-Keuls test. *p < 0.01. The source data underlying b, d, e, g are provided in the Source Data file.

