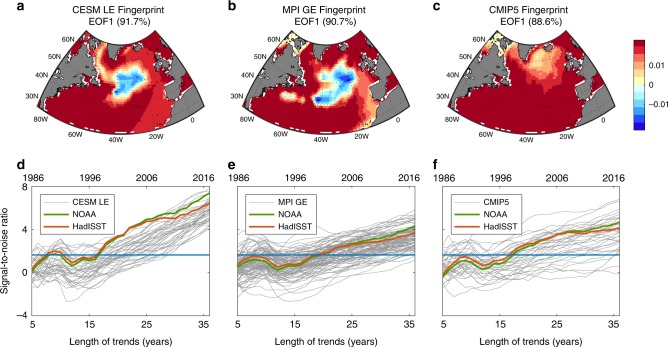
Fig. 2. Fingerprints and signal-to-noise analysis.
The leading mode (fingerprint) of the 1982–2017 North Atlantic sea surface temperature anomalies in the a Community Earth System Model Large Ensemble (CESM-LE), b Max Planck Institute for Meteorology Grand Ensemble (MPI-GE), and c Coupled Model Intercomparison Project Phase 5 (CMIP5). The percentage in each panel represents the variability explained by each mode. Signal-to-noise ratio for North Atlantic sea surface temperature as a function of the length of trends (and corresponding last year of trend) since 1982 using the fingerprint and noise from d CESM-LE, e MPI-GE, and f CMIP5. The signal in the green and orange lines is calculated using the satellite-based observations in NOAA, and HadISST, respectively. The signal in the gray lines in each panel is calculated using each realization in the CESM-LE, MPI-GE, and CMIP5 datasets. The blue horizontal line marks the 5% significance threshold.

