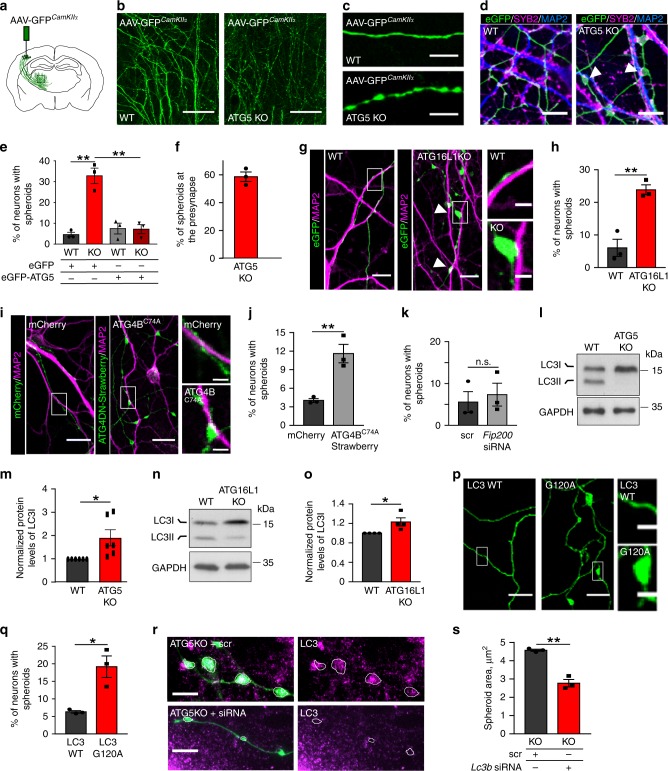
Fig. 2. Loss LC3 lipidation machinery causes axonal neurodegeneration.
a Schematic illustration of stereotaxic delivery of AAV9-GFPCamKIIa into deep layers of primary motor cortex. b, c Loss of ATG5 causes en-passant swellings of long-range projection axons. Scale bar, (b) 200 µm, (c) 10 µm. d eGFP-transfected WT and ATG5 KO neurons immunostained for MAP2 and SYB2. Scale bar, 50 µm. e Percentage of WT and ATG5 KO neurons revealing axonal swellings when transfected either with eGFP (WT: 4.60 ± 1.09%, KO: 32.82 ± 3.70%) or with ATG5-eGFP (WT: 7.47 ± 2.60%, KO: 7.18 ± 2.20%). **pWTGFP vs. KOGFP = 0.001, **pWTATG5 vs. KOATG5 = 0.002. N = 3 independent experiments. f Axonal swellings are mostly found at presynapses (58.62 ± 0.81%). g, h Percentage of eGFP-transfected WT and ATG16L1 KO neurons with axonal swellings (WT: 6.05 ± 2.14%, KO: 23.85 ± 1.24%), **p = 0.004, N = 3 independent experiments. Scale bars: 10 µm, inserts 2 µm. i, j Percentage of mCherry-ATG4BC74A or pmStrawberry-ATG4BC74A (green)-transfected neurons revealing axonal swellings (mCherry: 4.03 ± 0.25%, pmStrawberry-Atg4BC74A 11.60 ± 1.22%). **p = 0.008. N = 3 independent experiments. Scale bars: 10 µm, inserts 2 µm. k Percentage of axonal swellings in neurons with Fip200 siRNA-mediated KD (scr:4.46 ± 2.40%, siRNA:5.78 ± 2.87%). p = 0.659. N = 4 independent experiments. l–o LC3I protein levels are significantly increased in ATG5 KO (1.91 ± 0.35, *p = 0.023, N = 6 independent experiments) and ATG16L1 KO (1.23 ± 0.08, *p = 0.04, N = 4 independent experiments) lysates, compared to WT controls set to 1. p, q Percentage of ptagRFP-LC3B (proLC3)- or ptagRFP-LC3B G120A-expressing neurons with axonal swellings (ptagRFP- LC3B: 6.29 ± 0.30%, ptagRFP- LC3B G120A: 19.16 ± 2.50%). *p = 0.014. N = 3 independent experiments. Neurons were co-transfected with eGFP to visualize the axons. Scale bars: 4 µm, kymographs, 5 µm × 20 s. r, s Knockdown of LC3B in ATG5 KO neurons significantly decreases axonal spheroid area (KOscr: 4.57 ± 0.06 µm2, KOsiLC3b2.78 ± 0.20 µm2). **p = 0.001. N = 3 independent experiments. eGFP-expressing ATG5 KO neurons were treated either with scramble siRNA (scr) or LC3b siRNA and immunostained for LC3. Circles indicate en-passant axonal swellings. Scale bars: 5 µm. All graphs show mean ± SEM, statistical analysis was performed by unpaired two-tailed Student’s t‐test in (h, j, k, q, s), two-way ANOVA for multiple comparisons in (e) and by one-sample Student’s t‐test in (m, o). n.s.-non-significant. Total number of neurons in N experiments is shown in Supplementary Table 3. Source data are provided as a Source Data file.

