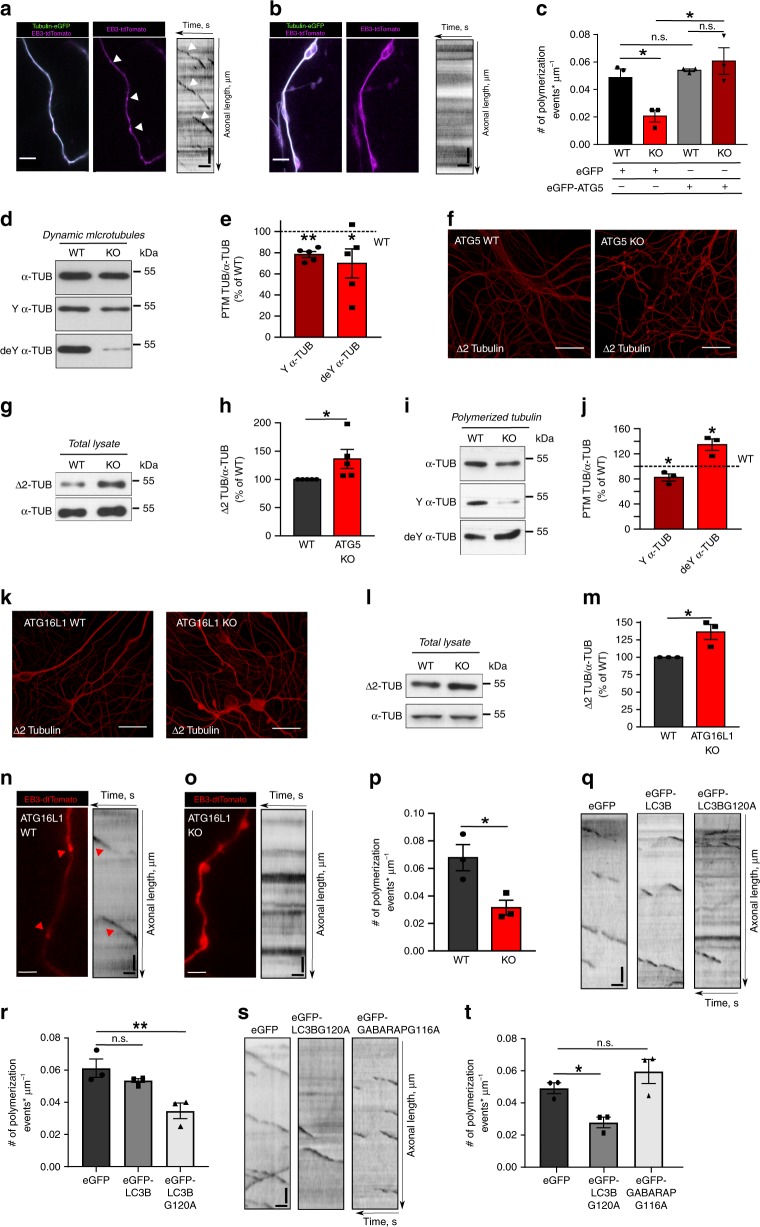
Fig. 4. LC3 lipid conjugation machinery regulates MT dynamics.
a, b Time-lapse images and corresponding kymographs of WT and ATG5 KO axons co-expressing Tubulin-eGFP and EB3-tdTomato. Arrows indicate EB3 comets in WT neurons. c EB3 comet density in WT and ATG5 KO axons, expressing either eGFP (WTGFP: 0.05 ± 0.01, KOGFP: 0.02 ± 0.00) or eGFP-ATG5 (WTATG5: 0.05 ± 0.00, KOATG5: 0.06 ± 0.01). *pWTGFP vs. KOGFP = 0.032, *pKOGFP vs. KOATG5 = 0.019. N = 3 independent experiments. d, e Levels of tyrosinated (Y) (78.28 ± 3.12%, **p = 0.001) and detyrosinated (deY) (69.85 ± 13.75%, *p = 0.047) α-Tubulin in dynamic ATG5 KO MTs. N = 5 independent experiments. f–h Δ2α-Tubulin levels in immunostained (f) and lysed (g, h) cultured WT and ATG5 KO neurons (KO: 136.13 ± 16.78%). *p = 0.049. N = 5 independent experiments. Scale bars, 50 µm. i, j Levels of tyrosinated (Y) (82.25 ± 5.75%, *p = 0.045) and detyrosinated (deY) (134.49.25 ± 9.09%, *p = 0.032) α-Tubulin in polymerized ATG5 KO MTs. N = 3 independent experiments. k–m Δ2α-Tubulin levels in in immunostained (k) and lysed (l, m) cultured WT and ATG16L1 KO neurons (KO: 136.18 ± 10.79%). *p = 0.039. N = 3 independent experiments. Scale bars: 50 µm. n–p Representative images, kymographs and comet density of EB3-tdTomato-expressing WT (0.07 ± 0.01) and ATG16L1 (0.03 ± 0.01) KO axons. *p = 0.029. N = 3 independent experiments. q, r Representative kymographs and comet density in EB3-tdTomato-expressing axons, transfected with either eGFP (0.061 ± 0.006), eGFP-LC3B (0.054 ± 0.001) or eGFP-LC3B G120A (0.035 ± 0.005). **peGFP vs. eGFP-LC3B G120A = 0.009, peGFP vs. eGFP-LC3B = 0.413. N = 3 independent experiments. s, t Representative kymographs and comet density in EB3-tdTomato-expressing axons, co-transfected either with eGFP (0.049 ± 0.003), eGFP-LC3B G120A (0.028 ± 0.003) or eGFP-GABARAP G116A (0.060 ± 0.008), *peGFP vs. eGFP-LC3B G120A = 0.044, peGFP vs. eGFP-GABARAP G116A = 0.321. N = 3 independent experiments. All graphs show mean ± SEM, statistical analysis was performed by unpaired two-tailed Student’s t‐test in (p), two-way ANOVA for multiple comparisons in (c), one-way ANOVA for multiple comparisons in (r, t) and one-sample Student’s t‐test in (e, h, j, m). n.s.-non-significant. In (e, h, j, m) KO protein levels were normalized to the WT set to 100%. In (e, h, j, m) samples arise from the same experiment and the blots were processed in parallel such that one loading control was used. Total number of neurons in N experiments is shown in Supplementary Table 3. Source data are provided as a Source Data file. Scale bar for all kymographs x: 5 µm, y: 20 s.

