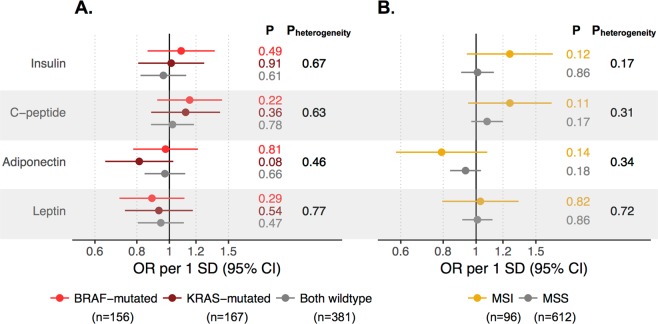
Figure 4.
Odds ratios (ORs) of CRC by (A) KRAS and BRAF mutation status and (B) MSI status per 1 SD increase in metabolic biomarkers. Estimated in 1010 cases and 1010 matched controls, adjusted for matching variables and smoking, occupational and recreational physical activity, alcohol intake, and BMI. Heterogeneity across molecular subtypes was tested with a likelihood ratio test, comparing a model in which the risk association could vary across subtypes to a model were all associations were held constant. Numbers (n) within subtypes represent complete cases, molecular data for the remaining cases were imputed.

