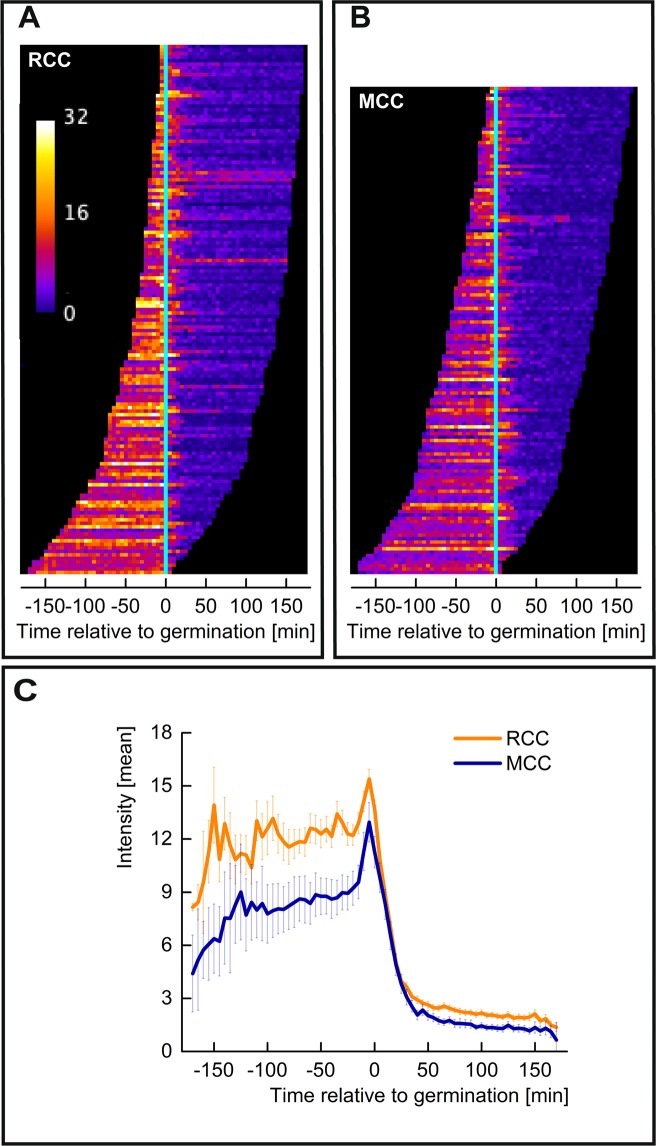
Figure 6.
Dynamics of germinosomes during germination. (A,B) Map of Leaders displays the germinosome dynamics of RCC and MCC spore populations, respectively. For each spore, sorted from early to late germination, the leader history is displayed as one row of pixels. Here t = 0 represents the time of germination. (C) Collective profiles of RCC and MCC are obtained by vertical average-projection of the respective map. Error bars correspond to 95% confidence.

