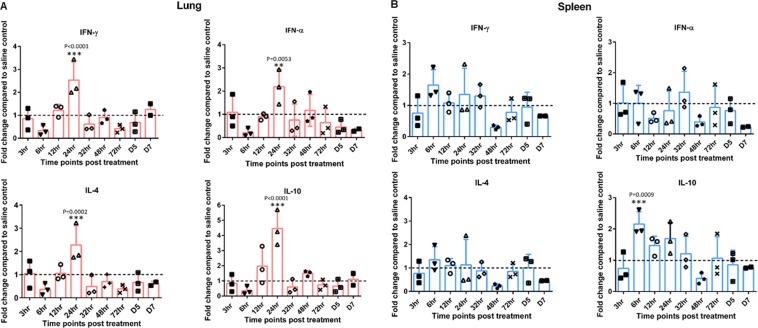
Figure 3.
Interferon and regulatory cytokine profile in lung and spleen. The luminescence intensity of each gene was normalized to the averages of HKGs (Hprt 1 and Tubb 1). Fold changes were calculated against the control at each time point. (Broken lines indicate the fold change of one, which shows no change compared to the control group). Sidak multiple comparisons test following ANOVA was used to analyse the significance of gene expression between CpG-ODN and the saline control group at each time point. Asterisks indicate the fold changes that were significantly different (P < 0.05).

