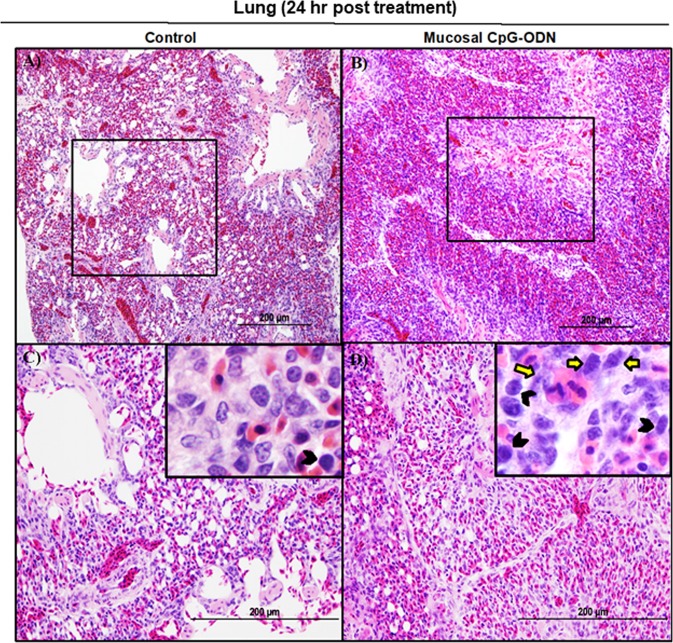
Figure 6.
Histology of lungs 24 hr post treatment with IPL saline (A and C) or IPL CpG-ODN (B and D). Low power images (20×) indicated a clearly visible high degree of immune cell infiltration in the CpG-ODN treated lung (B) compared to the less cellularity and clearly visible air spaces in the saline control lungs (A). At higher power (40× and 100×), the IPL CpG-ODN received lung showed a distinctly higher number of lymphocytes (black arrow heads in the insert) and large mononuclear cells resembling monocytes/ macrophages (yellow arrows in the insert) infiltrated into the parenchyma (D) compared to the less number of those cells visible in the saline control lung (C).

