Figure 7.
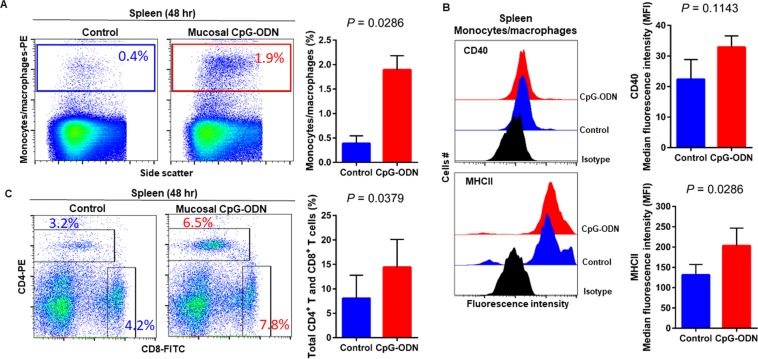
Flow cytometric analysis of spleen cells at 48 hr post IPL CpG-ODN or saline treatment. (A) Macrophage analysis was performed by gating on monocytes/macrophages population in the spleen based on forward and side scatter. Bar diagram represents percent monocytes/macrophages infiltration. (B) Histogram and bar diagram displays the median fluorescence intensity (MFI) of CD40 (upper panel) and MHC II (lower panel) expression on monocytes/macrophages, respectively. Cells were gated as shown in the panel A. (C) T lymphocyte population in the spleen analysed by gating on the lymphocyte population based on forward and side scatter plot. Quantification of CD4+ and CD8+ T lymphocytes was done by using PE-labeled mouse anti-chicken CD4 and FITC-labeled mouse anti-chicken CD8 monoclonal antibodies. Bar diagram indicates the mean total CD4+ plus CD8+ T lymphocyte percentages in the spleen following IPL CpG-ODN treatment. Difference of cellular infiltration and monocyte/macrophages maturation marker expression (MFI) between the CpG-ODN administered group vs saline control group were compared using Student-t test with Mann-Whitney test, with P < 0.05 being statistically significant. Error bar = Standard Deviation (n = 4).

