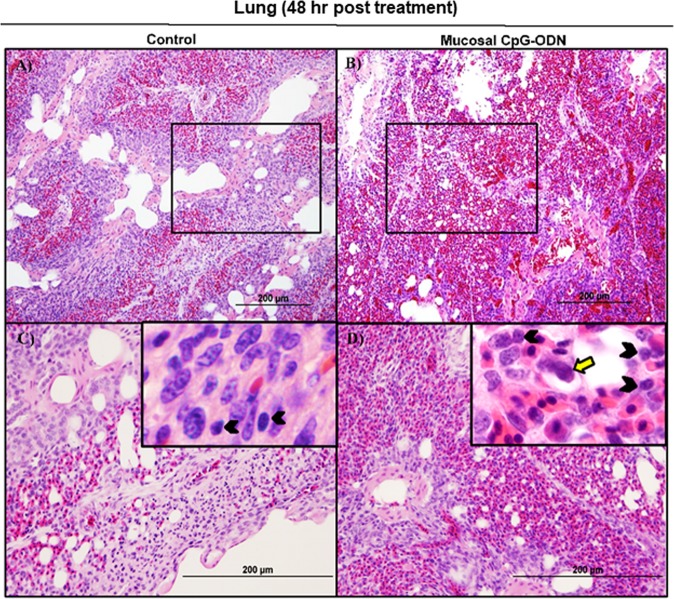
Figure 9.
Histology of the lungs 48 hr following IPL saline (A and C) and IPL CpG-ODN delivery (B and D). At lower magnification (20×), saline control lungs appeared less cellular and paler with clear air spaces (A) than the CpG-ODN treated lungs distinctly infiltrated with large numbers of lymphocytes (B). However, this cellularity in the CpG-ODN lungs was visibly quite lower than what was observed 24 hours post treatment. At higher magnification (40× and 100×), more lymphocytes (black arrowheads in the insert) and mononuclear cells resembling monocytes and macrophages (yellow arrows in the insert) were seen in the parenchyma of IPL CpG-ODN lungs (D) compared to the saline control lungs (C).

