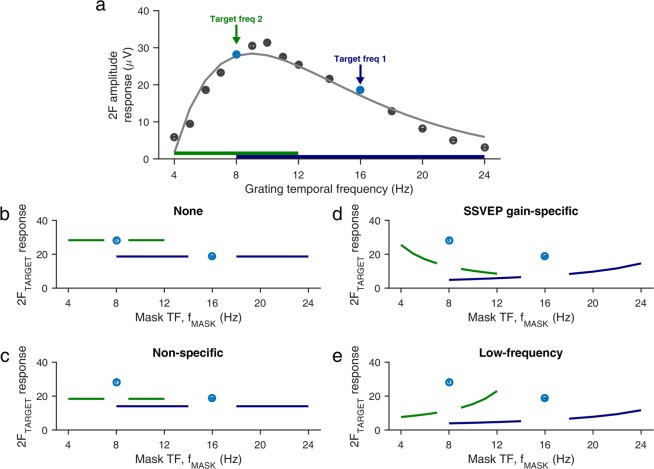
Figure 2.
Hypotheses for interaction between competing SSVEP tags. Mean SSVEP amplitude response over LFP electrodes from both monkeys as a function of TF (a), averaged over 25% contrast grating conditions from Experiments 1 and 2. Error bars denote ±1 SEM and are smaller than the marker size when not visible. Smooth gray curve indicates the difference of exponentials fit to the mean response. Arrows and thick horizontal bars indicate, respectively, the target frequencies and the corresponding mask frequencies used in Experiment 2. Panels below depict hypothetical target frequency SSVEP amplitude responses for no TF suppression (b), non-specific suppression (c), SSVEP gain-specific suppression (d) and low-frequency suppression (e).

