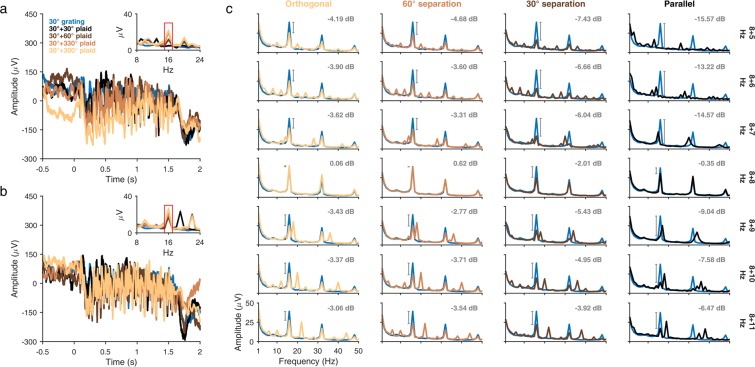
Figure 4.
LFP amplitude suppression (8 Hz target frequency). Same as in Fig. 3, but for the 8 Hz target frequency. Evoked response is plotted for the same monkey and electrode for plaid stimuli composed of an 8 Hz target grating (30°) and a 5 Hz (a) or 11 Hz (b) mask grating (30°, black; 60°, brown; 330°, orange; 300°, light brown). Amplitude spectrum of the 8 Hz mask-only condition (30°, blue) is also plotted. Target-only amplitude spectrum in (c) is averaged across sessions from Experiment 1 for the 8 Hz, 25% contrast condition. Numbers in (c) indicate mean change in power (in dB) at 16 Hz from the target-only condition to the corresponding plaid conditions.

