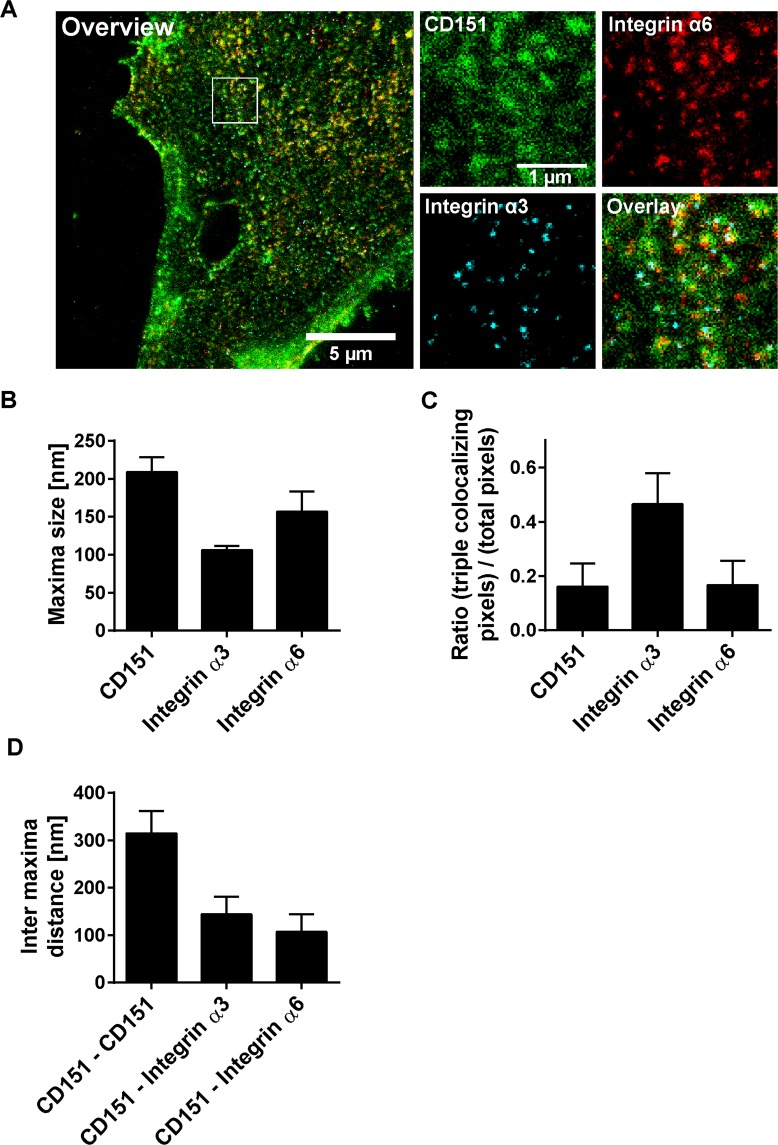
Figure 3.
Characteristics of CD151 and integrin maxima. CD151-GFP was transfected into HaCaT cells. CD151-GFP and endogenous CD151 localize to the same domains (Fig. S7E,F) and CD151-GFP is as functional as non-tagged CD151 (Fig. S8). One day after transfection, cells were treated for 5 h without or with PsVs (Fig. S9), washed, membrane sheets were generated, stained and analyzed by three channel STED microscopy. Green lookup table, CD151-GFP visualized by nanobodies; red and cyan lookup tables, integrin α6 and integrin α3 stained by antibody labeling, respectively. Images are displayed at arbitrary intensity scalings (linear lookup tables). Staining with the integrin antibodies is highly specific (Fig. S1). (A) Large panel, membrane sheet (channel overlay). The white box marks an area from which magnified views of the individual channels are shown. From regions of interest (ROIs) we measured (B) maxima size and signal overlap (C). For (C), for all three channels within a ROI the pixels with an intensity higher than the average ROI intensity were selected. Then, the number of pixels positive in all three channels were related to the number of all positive pixels in one specific channel as indicated. (D) Shortest inter-maxima distances of CD151-GFP to CD151-GFP, integrin α3 or integrin α6. Values are given as means ± SD (n = 60 membrane sheets collected from three biological replicates).

