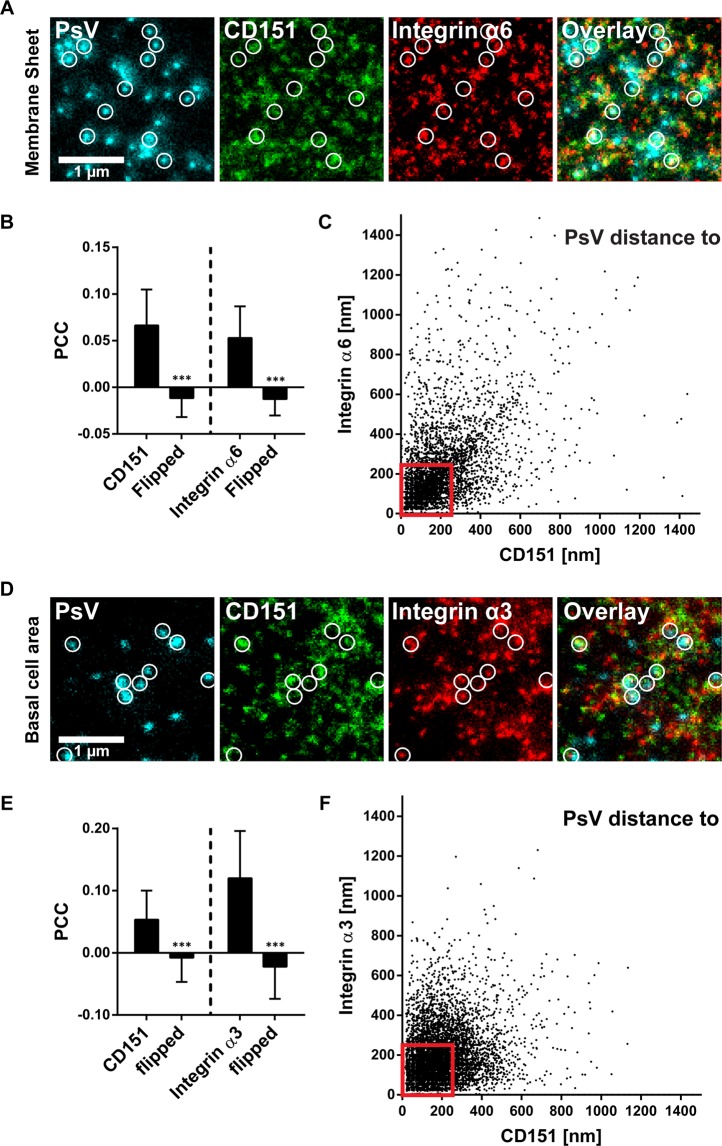
Figure 4.
Viral particle distance to CD151 and integrin maxima. (A–C) Membrane sheets were generated from HaCaT cells treated for 5 h with EdU-PsVs. They were stained for EdU-PsVs (cyan lookup table; click-labelled with fluorescein), CD151 (green lookup table; immunostaining) and integrin α6 (red lookup table; immunostaining), followed by STED microscopy imaging. (A) Images from the three channels and an overlay are shown and displayed at arbitrary intensity scalings (linear lookup tables). Circles mark identical pixel locations. (B) Pearson correlation coefficient between PsVs and CD151 (left) and integrin α6 (right). A control value for randomized distribution (‘flipped’) was calculated after flipping of one channel. (C) For individual PsVs, we plotted their nearest distance to a CD151 and an integrin α6 maximum (the analysis includes 4452 PsVs from 57 membrane sheets collected from three biological replicates). (D–F) As in (A–C) but cells were analysed and we stained for integrin α3 (the plot in F includes 8519 analyzed PsVs from 60 cells collected from three biological replicates). The pattern of PsV binding to the cell membrane looks the same on cells and membrane sheets (Fig. S10). Values are given as means ± SD (n = 57 membrane sheets or 60 cells, each collected from three biological replicates). Statistical analysis was performed employing the unpaired Student’s t-test comparing the original to the flipped images (***p < 0.001). Red boxes frame viral particles potentially used for further analysis of the platform area (Fig. 5). Only PsVs were considered that were closer than 250 nm to bright CD151/integrin maxima.

