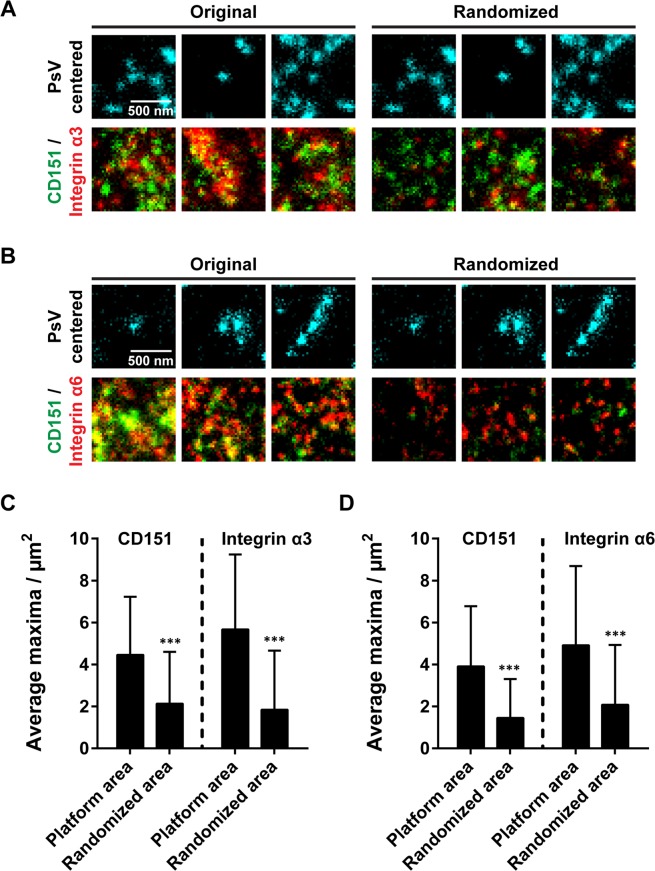
Figure 5.
Local crowding of clusters at virus attachment sites. To characterize the anatomy of a possibly forming viral platform area, we selected those PsVs from Fig. 4C,F with a distance smaller than 250 nm to both a bright CD151 and integrin maximum (for examples see centrally located PsVs in the left panels in A and B). In a PsV-centred 1 µm × 1 µm ROI the number of bright maxima (see methods) in the CD151 and integrin channels were counted. The same was performed after flipping the CD151/integrin channels, causing a randomized relationship between PsV-attachment sites and maxima (A and B, right panels). In the original images more closely associated maxima are present at sites of PsV-attachment. Images are displayed in cyan (PsV) green (CD151) and red (integrin) at arbitrary intensity scalings (linear lookup tables). (C,D), quantification of the bright maxima in the 1 µm × 1 µm ROI. Values are given as means ± SD (n = 678 (C) and 283 (D) 1 µm × 1 µm ROIs, respectively). Statistical analysis was performed employing the unpaired Student’s t-test comparing the original to the randomized condition (***p < 0.001). Please note, that the number of clusters per attachment site was highly variable. For a histogram illustrating the variability see Fig. S12.

