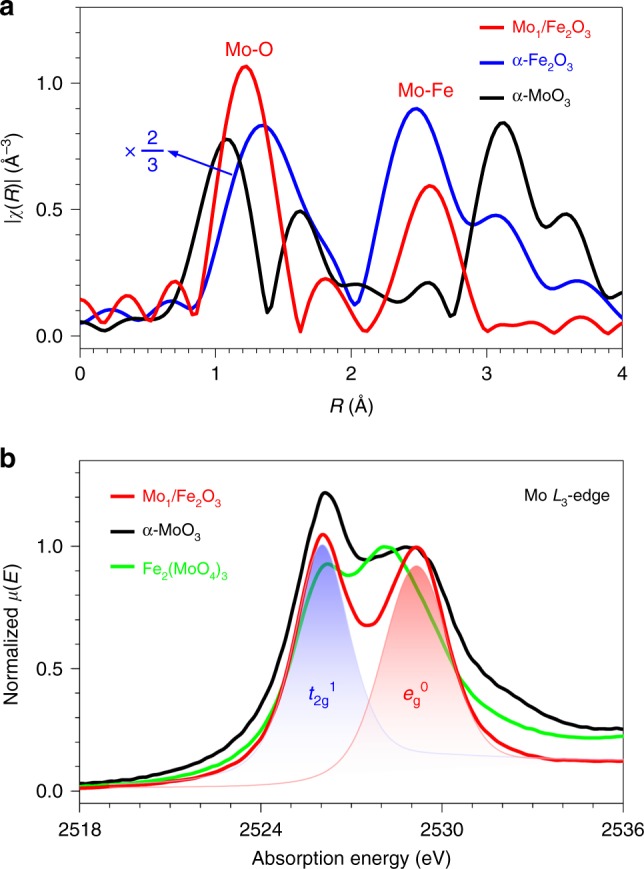
Fig. 2. The geometric structure of the MoO6 motif and the electronic structure of the isolated Mo ions.

a χ(R) k2-weighted FT-EXAFS spectra of Mo1/Fe2O3 (red line) and α-MoO3 (black line) at the Mo K-edge together with α-Fe2O3 (blue line) at the Fe K-edge. b Mo L3-edge X-ray absorption spectra of Mo1/Fe2O3 (red line), α-MoO3 (black line) and Fe2(MoO4)3 (green line). Blue and red shades represent the unoccupied states of the Mo t2g and eg orbitals, respectively.
