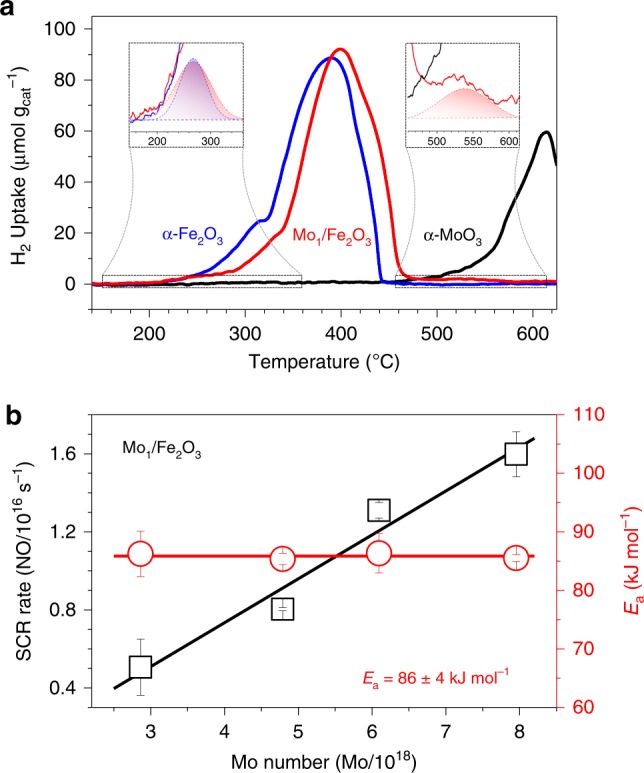
Fig. 3. Redox property of dinuclear sites and identification of the active sites.

a H2-TPR profiles of Mo1/Fe2O3 (red line) with a 1.3 wt% Mo loading, α-Fe2O3 (blue line) and α-MoO3 (black line). Insets: enlargements of the selected regimes together with the fitting data, and the curves of α-MoO3 and α-Fe2O3 are omitted in the up-left and up-right insets, respectively, for clarity. b SCR rates (black square) at 270 °C and Ea (red circle) on Mo1/Fe2O3 with the different Mo number. The error bars represent standard error.
