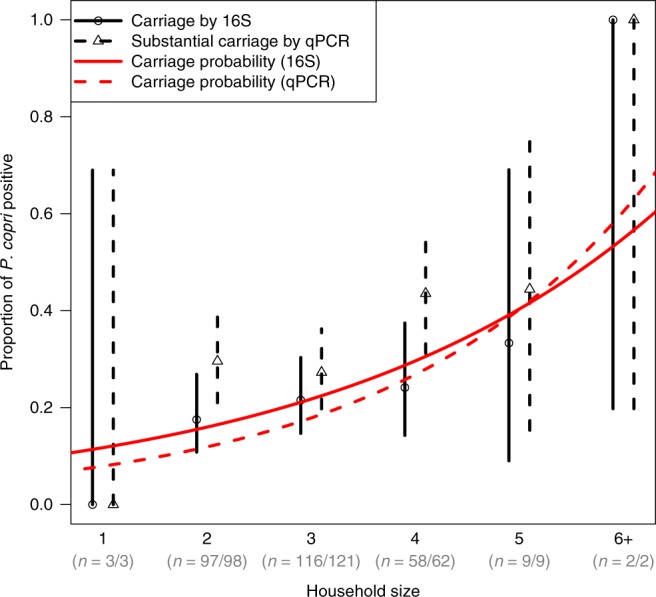
Fig. 5. Household size and the proportion of mothers with P. copri detected in fecal samples collected during pregnancy.

Solid lines and circular symbols refer to P. copri carriage according to 16S sequencing, dashed lines and triangular symbols to substantial P. copri carriage according to qPCR analysis. Vertical lines indicate 95% CIs for the proportion and the red curves describe the predicted probability of carriage via logarithmic regression (risk ratio 1.36 per additional household member via 16S, 95%CI (1.13, 1.65), p = 0.001; RR 1.50 per additional member via qPCR, 95%CI (1.33, 1.70), p < 0.001; Wald test in logarithmic regression). The two largest households (containing six and seven members) are plotted as 6+ but were treated in the regression using their original values. Numbers of households in each size category are given for 16S/qPCR data available, respectively.
