Figure 1.
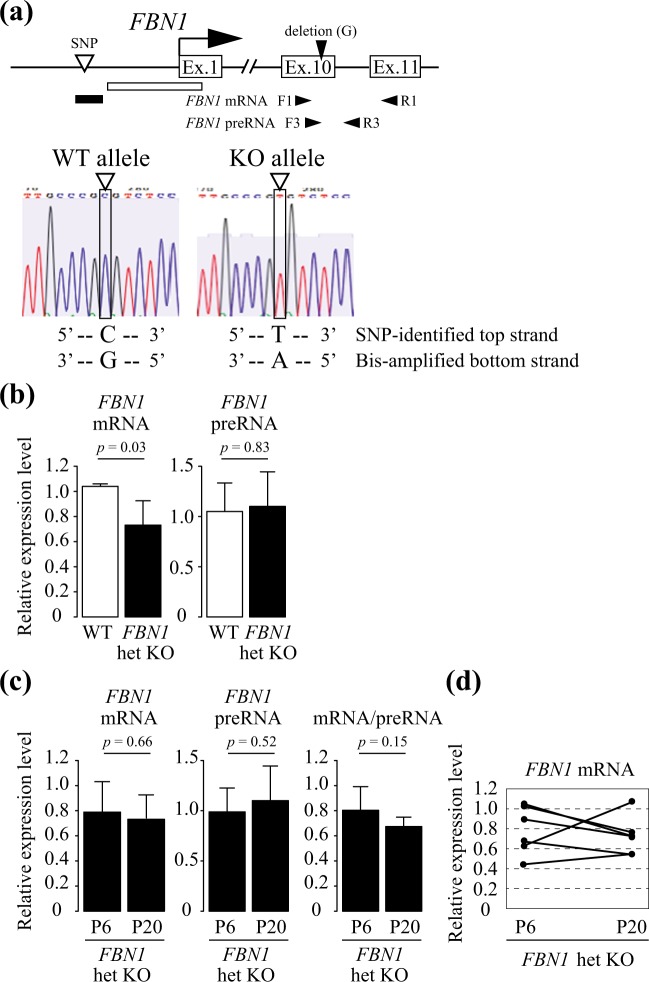
FBN1 mRNA and preRNA levels in porcine FBN1 het KO fibroblast cells depending on the normal (WT) and FBN1-mutated null (KO) alleles. (a) The upper panel shows a schematic of SNP and RT-PCR primer positions in the porcine FBN1 locus. The RT-PCR primers were designed to amplify regions including the 1-bp deletion site (guanine, G) in the FBN1 exon 10. FBN1 mRNA and preRNA were amplified with the specific primer sets (F1 and R1) and (F3 and R3), respectively. White and black squares indicate the FBN1 CpG island and the CpG island shore, respectively. The lower panel shows sequencing data of the SNP position in the FBN1 CpG island shore. Open triangles indicate the position of the SNP-identified top strand in the FBN1 het KO pigs (C: WT allele, T: KO allele). The same position of the SNP in the complementary strand is G in the WT allele and A in the KO allele, and was amplified by sodium bisulfite PCR. (b) Expression levels of the FBN1 mRNA and preRNA in wild-type fibroblast cells (n = 3) and FBN1 het KO fibroblast cells (n = 6) were evaluated by RT-PCR. (c) Expression levels of the FBN1 mRNA, preRNA, and ratio of mRNA to preRNA (mRNA/preRNA) in FBN1 het KO fibroblast cells (n = 6) collected at passages 6 and 20 (P6 and P20) were measured by RT-PCR. (d) Changes of FBN1 mRNA levels from P6 to P20 in each FBN1 het KO fibroblast cell line (n = 6). These data are based on the FBN1 mRNA data in (c). The relative expression levels of FBN1 mRNA and preRNA in (b,c) were normalized to GAPDH expression and shown as mean ± SD (n = 3). Statistical comparisons of the expression levels were performed using the Student’s t-test, and statistical significance was set as p < 0.05.

